Calculate Your Monthly Cost

Plug in your coverage type, state, employee count and vehicle type (if you need commercial auto coverage) to get a cost estimate built around your operation. All estimates reflect aggregated rates across all 50 states and Washington, D.C., with no personal information required, and workers' comp estimates are calculated per employee.

Select Coverage Type
Select State
Select Employee Count
Select Vehicle Type
Average Monthly Estimate

How Much Does Food & Beverage Business Insurance Cost?

Food and beverage insurance costs range widely because a vending machine service and a full-service catering company carry very different risk profiles. The average cost of business insurance for food and beverage businesses is $101 monthly, or $1,209 annually. Those figures reflect 26 subindustries across 50 states and Washington, D.C. The analysis used quotes from the five most common coverage types for businesses with one to four employees, and the numbers are best read as benchmarks rather than quotes.

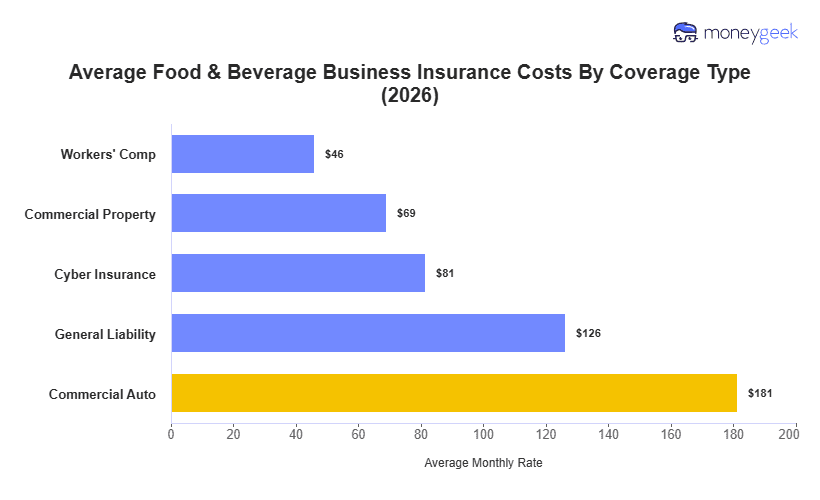
The spread across coverage types runs from $46 monthly for workers' comp to $181 monthly for commercial auto. Workers' comp prices on payroll, which keeps those rates low for small kitchen and counter crews. Commercial auto lands highest because vehicle use in this industry is intensive. Food trucks run daily service, caterers haul equipment to events and pizza or meal delivery puts drivers on the road repeatedly. The breakdowns below show how costs shift by coverage type:

Workers' Comp$46$55059%8
Commercial Property$69$82645%18
Cyber Insurance$81$9762%16
General Liability$126$1,5163%22
Commercial Auto$181$2,175-11%19

We analyzed quote data from major U.S. commercial insurance providers and modeled standardized premium estimates across business profiles representing around 95% of the market. Results are designed to provide a consistent national benchmark showing how premiums vary by key baseline factors including business size, cleaning profession type, location and vehicle type for operations that use commercial vehicles.

Dataset Scope and Assumptions

Our cost modeling uses standardized inputs for consistent comparisons across businesses.

  • Total estimates modeled: just over 6 million standardized pricing estimates
  • Providers analyzed: 10 major insurance providers
  • Professions covered: 26 food and beverage profession categories
  • Geography: all U.S. states including Washington, D.C.
  • Employee count bands: solo practitioners, one to four, five to nine, 10 to 19, and 20 to 49 employees
  • Vehicle types studied: Sedans, SUVs, pickup trucks, vans, taxis, limousines, tractors, food trucks, semi-trucks (non-HAZMAT and HAZMAT), tanker trucks (non-HAZMAT and HAZMAT), buses, box trucks, dump trucks, flatbed trucks
  • Policies studied: general liability, workers' comp, commercial auto, commercial property, and cyber insurance
    • General liability: $1 million per occurrence and $2 million aggregate
    • Workers' comp: state required coverage
    • Commercial auto: minimum coverage
    • Commercial property: personal property coverage limits personalized to industry, business size and state
    • Cyber insurance: $1 million per occurrence and $1 million aggregate

How We Calculated Average Food & Beverage Business Insurance Costs

Our published averages represent modeled premiums for standardized business profiles and were aggregated in two ways.

  • National benchmark average: The national average cost reflects the modeled premium for a standardized one to four employee business across all cleaning profession categories and states included in our dataset for a standard professional liability policy
  • Segment averages: To show how costs vary, we calculated average modeled premiums for our national base profile and isolated for variables, including:
    • Employee count (business size ranges)
    • Profession / industry categories
    • Vehicle types (for commercial auto)
    • States (including Washington, D.C.)

Segment averages were produced by aggregating modeled pricing trends across the full dataset so readers can compare how premiums shift across profession types and regions.
See our full business insurance methodology.

If you want to see business insurance costs for specific food and beverage subindustries, these pages provide more information:

How Much Does General Liability Insurance Cost for Food & Beverage Businesses?

Food and beverage businesses run on physical presence, and the average cost of general liability insurance reflects that. GL covers the claims that define food service exposure: a dining room slip, a catering crew damaging a client venue, a spill during service. Costs run around $79 to $163 monthly, with business type, employee count and location shaping the range. The breakdowns below show how far each one shifts the rate.

How Much Does Workers’ Comp Insurance Cost for Food & Beverage Businesses?

Workers' comp costs for run from around $17 to $198 per month per employee, with most roles sitting at the lower end because software engineers, UX designers and data analysts write code, run tests and manage systems rather than physical work that generates injury claims. State and sub-industry both move the rate, and the breakdown below shows just how wide that spread can get.

How Much Does Commercial Property Insurance Cost for Food & Beverage Businesses?

What a food business owns and operates on-site determines how much commercial property coverage costs. A food vendor with a cart and basic supplies prices around $31 monthly, while a wine bar with inventory, refrigeration and fixtures runs closer to $118. Equipment value, stock and location all contribute to how insurers determine premiums for your food business.

How Much Does Commercial Auto Insurance Cost for Food & Beverage Businesses?

Any food or beverage business that uses vehicles for work needs commercial auto coverage, since personal auto policies exclude business use. Commercial auto insurance costs range runs from around $116 monthly for a bartender to $259 for a food truck. Vehicle type, driver record and road frequency all shape the rate. Find your vehicle type in the breakdowns below.

How Much Does Cyber Insurance Cost for Food & Beverage Businesses

Food and beverage businesses collect card data, customer records and online order histories that cyber insurance covers. The cyber insurance costs for F&B operations run from around $42 monthly for a vending machine service to $104 for a wine bar. Transaction volume, online ordering and customer record volume all move the rate. Each breakdown below shows how costs shift by sub-industry, size and state.

Factors Affecting Food & Beverage Business Insurance Costs

Several variables shape the cost of food and beverage business insurance, and they don't all carry equal weight. A food truck and a full-service restaurant carry the same coverage types but pay very different rates. The factors below explain why:

    business icon
    Business size

    Kitchen and counter staff carry real injury risk from hot surfaces, sharp tools and wet floors, and every new hire raises the workers' comp exposure. More front-of-house staff means more customer interactions and a higher chance of slip-and-fall claims. Larger operations also own more commercial equipment, perishable stock and fixtures, which pushes property costs higher.

    pin icon
    Location

    State workers' comp rates for food service roles vary widely, and so do liquor liability laws, minimum wage levels and commercial property replacement costs. A full-service bar in California pays more across nearly every coverage type than the same concept in Indiana, not because the operation is different but because the state environment is.

    niceMeal icon
    Type of operation

    Whether a business runs a food truck, operates a bar or manages a commercial kitchen affects nearly every coverage type it carries. A wine bar has alcohol liability exposure that a coffee shop does not. A pizza delivery operation needs commercial auto coverage that a vending machine service may not.

    wine icon
    Alcohol service

    Food and beverage businesses that serve alcohol carry higher liability exposure than those that don't. Liquor liability claims, assault and battery incidents and dram shop laws create additional legal risk for bars, sports bars, wine bars and restaurants with full bar service.

    rideshare icon
    Vehicle use

    Food trucks, ice cream trucks and mobile caterers use their vehicle to generate revenue, not just for transport. The vehicle earns on every service day rather than sitting idle between runs. Both need commercial auto coverage, but the rate reflects how much of the business runs from the road.

    smallBusiness icon
    On-premises customer activity

    A restaurant with a full dining room, bar seating and weekend foot traffic carries far more premises liability than a ghost kitchen or delivery-only operation. The more customers a food business hosts on-site, the more exposure it creates for slip-and-fall incidents, property damage and service-related claims. A pickup-only counter cuts that exposure considerably.

How to Lower Food & Beverage Business Insurance Costs

Some methods for finding affordable business insurance take effect within the current policy period; others take a full renewal cycle or longer to change rates for food and beverage operations.

Quick Food & Beverage Business Insurance Cost Lowering Methods

These five methods can reduce what a food or beverage business pays without waiting for a full renewal cycle or changing how the operation runs:

    vsDocuments icon
    Compare quotes using the same coverage limits

    Insurance pricing for food and beverage businesses varies more than most owners expect. Two policies with the same label can carry different limits, exclusions and sublimits that make a direct price comparison meaningless. Compare using identical limits, deductibles and coverage types, including any endorsements a food service operation may need, such as liquor liability or hired and non-owned auto.

    uninsured icon
    Right-size your coverage

    Overpaying often comes from carrying coverage built for a larger or higher-risk operation than the one actually running. A ghost kitchen with no public dining room does not need the same premises liability limits as a 100-seat restaurant. Audit each policy against the actual risk profile of the business, and scale back where the exposure does not warrant the premium.

    money2 icon
    Increase your deductible strategically

    Raising the deductible on commercial property coverage cuts premiums for food businesses with heavy commercial equipment. A year-round diner can absorb a large claim more easily than a catering company in a slow month, when cash runs thin. Avoid applying this to workers' comp, where claim frequency in kitchens runs high.

    shoppingBag icon
    Bundle policies with the same provider

    A bar running general liability, commercial property, workers' comp and liquor liability with one carrier pays less than one that splits them across providers. Food and beverage businesses stack more policy types than most small operations, so the discount adds up faster. Food trucks that add commercial auto to the mix see the same benefit.

    calendarV2 icon
    Pay annually instead of monthly

    Farmers market vendors, event caterers and other seasonal food operations often have a natural revenue window where paying the full annual premium is more manageable. Annual payment eliminates the installment fees that monthly plans add to the total cost and, in many cases, earns a modest upfront discount from the carrier.

Long-Term Food & Beverage Business Insurance Cost Lowering Methods

The methods below take longer to pay off but produce more durable savings for food and beverage businesses that build on them across policy periods.

    insurance2 icon
    Lower your risk profile

    Insurers price risk based on claims history and the operational factors that predict future claims. A food business that reduces alcohol-related incidents, improves kitchen safety protocols and limits slip-and-fall exposures builds a cleaner claims record over time. After two or three policy periods without claims, many carriers will adjust rates downward at renewal.

    ribbon icon
    Invest in risk management practices

    Risk management investments lower claims frequency over time, which directly affects renewal pricing across general liability, workers' comp and commercial property. Food businesses that document and act on risk have something concrete to show a carrier at renewal.

    • Schedule regular health and food safety inspections and document corrective actions. A clean inspection record reduces the likelihood of foodborne illness claims.
    • Train kitchen staff on burn prevention, knife handling and wet floor protocols. Workers' comp claims from kitchens are among the most frequent in the industry.
    • Implement ID verification and cut-off protocols for alcohol service. Dram shop liability claims are one of the most costly exposures for bars and full-service restaurants.
    • Use encrypted payment processing and limit POS access by role. Reducing data breach risk lowers cyber insurance costs over time.

Food & Beverage Business Insurance Cost: Bottom Line

Food and beverage businesses average $101 monthly across five coverage types, but when you request for quotes, individual premiums vary widely based on trade type, employee count and state. These three questions can help put figures in context:

  1. Where do you fall in the distribution? Food and beverage covers a wider range of operations than most industries. Use the breakdowns on this page to find your closest match in the data.
  2. Is your quote consistent with your risk profile? Alcohol service, foot traffic and vehicles push premiums above the average for many F&B operations. If a quote looks low, check whether it accounts for the exposures that come with your concept.
  3. Which cost drivers apply to your business? Vehicle use and alcohol service matter a great deal for some operations and barely register for others. A food truck and a coffee shop can pay similar premiums for entirely different reasons.

The difference between the industry benchmark and your quoted rate is a matter of a few operation-specific variables. Most food businesses find that two or three drivers account for the bulk of the distance. Use the benchmarks to calibrate your insurance costs, not as a prediction.

Food & Beverage Business Insurance Cost: Next Steps

If you are still working out which coverage types apply to your operation, start there before focusing on cost. The coverages that make sense for a food truck differ from those a wine bar or catering company needs, and the amounts follow from what the business actually does.

If you're ready to move forward, comparing quotes from multiple providers against the same coverage limits is the fastest way to see where the real pricing differences lie. Providers price food and beverage operations differently by business type, state and claims history, so identical specs will reveal where the gaps actually are.

If you want to know more about food and beverage business insurance

If your food business is new and has no claims history

If your quote is well above the benchmarks on this page

If you run a seasonal food operation

About Connor Bolton


Connor Bolton headshot

Connor Bolton is Senior SEO and Content Manager at MoneyGeek, where he leads the business and pet insurance editorial teams. As editorial lead for both verticals, Connor sets the research framework, data standards, and content structure that his writers execute, directly authoring in-depth guides himself and reviewing all team content for accuracy and practical value before it goes live. With over four years evaluating insurance products across personal, commercial, and specialty lines, he brings cross-vertical knowledge to every guide the team produces.

Connor architected MoneyGeek's insurance research infrastructure across all major verticals including auto, home, renters, life, health, business, and pet, building systems for pricing analysis, provider-level research, customer experience evaluation, and coverage analysis with AI support. The infrastructure includes over 6 million data points for business insurance across 408 industry areas, all 50 states, and 16 vehicle types, and over 5 million pet insurance profiles across 18 major providers and hundreds of breed and age combinations. Connor's insurance cost research and his team's work has been cited by the U.S. Chamber of Commerce, Allstate, Liberty Mutual, CBS News, Forbes and LegalZoom.

Beyond the data, Connor stays connected to how the market actually operates, drawing on direct conversations with underwriters and carrier liaisons at Ethos, The Hartford, NEXT Insurance, Nationwide, and State Farm, and monitoring business and pet owner communities including Reddit, to inform how he interprets findings and frames guidance for real buyers.

He is the direct editorial contact for methodology questions at connor@moneygeek.com and can be found on LinkedIn.