




Choose where to jump to next based on your needs:
Average General Liability Insurance Cost in Texas (2026 Report)
General liability insurance in Texas generally costs $28 to $350 per month, with your industry’s risk profile and the size of your business driving most of the difference in premiums.
If you're ready for a quote, get matched to the right general liability carrier for your Texas business with our tool below.
Select state
Updated: September 19, 2026
Advertising & Editorial Disclosure
How Much Does General Liability Insurance Cost in Texas?
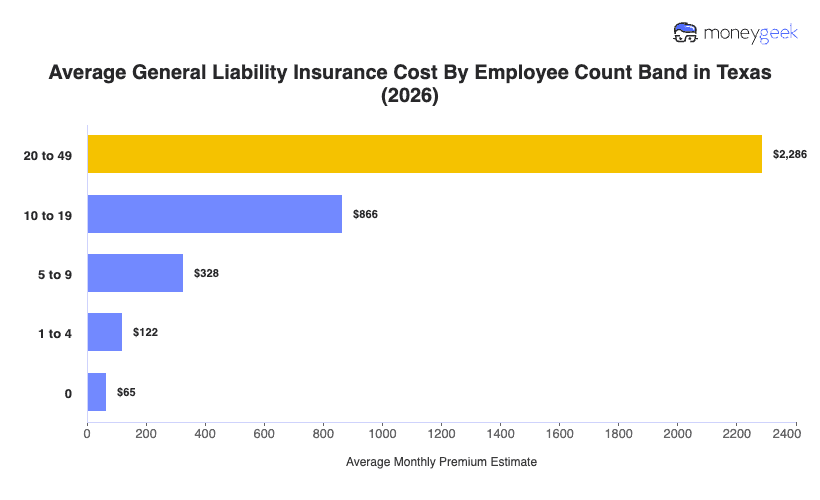
The average cost of general liability insurance for small businesses in Texas is $122 per month ($1,462 annually), based on a standard $1 million per occurrence/$2 million aggregate policy for businesses with one to four employees. Texas ranks 28th nationally for affordability, nearly matching the national average of $123 per month.
These figures represent a modeled benchmark across industries and business sizes, not a quote for any individual business. Your actual premium depends on your industry classification, employee count and operational details. The breakdowns below show how general liability costs shift across the variables that matter most in Texas.
To estimate average general liability insurance costs in Texas, we analyzed quote data from 10 major U.S. small business insurance providers and modeled over 20,000 standardized premium estimates across 25 general industry categories and five employee count bands (zero through 20 to 49). All estimates use a standard $1 million per occurrence/$2 million aggregate policy. We incorporated modeled average revenue and payroll across Texas regions, industries and employee counts using CBP, QCEW and Economic Census data, calibrated against private compensation databases and IRS SOI totals.
The Texas state average reflects the modeled premium for a standardized one-to-four-employee small business across all industries in our dataset. Segment averages isolate for variables like employee count and general industry category, showing how premiums shift across business types within Texas. These are benchmarks for comparison, not personalized quotes. Read full methodology.
Featured Partner

The Hartford
- The Hartford is MoneyGeek's cheapest general liability insurer nationally for 2026, at $102 a month.
- An A+ (Superior) financial strength rating from AM Best backs The Hartford's policies.
- Third-party bodily injury, property damage and personal or advertising injury claims are covered under The Hartford's general liability policy.
- Texas is one of 48 states where The Hartford writes small business coverage.
On The Hartford's site
*MoneyGeek featured partner. Editorial rankings below are independent of this placement. Rates, rankings and savings comparisons are based on MoneyGeek's independent research and Hartford-reported data as of 2026. Figures are estimates and averages, not a guarantee of any individual quote, premium or discount.
What Factors Affect General Liability Insurance Costs in Texas?
General liability costs in Texas depend on business characteristics that apply everywhere and state-level conditions specific to Texas. Knowing which drivers create the largest rate differences helps you identify where you fall in the cost distribution and what you can influence.
Texas Agnostic General Liability Insurance Cost Factors
Several pricing drivers affect general liability costs regardless of where a business operates. They reflect how insurers assess baseline exposure before applying state-level adjustments.
 Business size
Insurers price employee count as a proxy for exposure, since larger workforces drive more customer interactions, operational complexity and payroll-related liability events. In Texas, sole proprietors pay 47% less than the state average, while businesses with 20 to 49 employees pay 1,776% more. The spread confirms employee count is the primary driver of business size pricing tiers.
 Industry classification
Insurers price industry type based on liability exposure, with claim frequency tied to physical hazards, customer interaction intensity and worksite conditions. Hands-on trades at customer locations carry higher risk profiles than desk-based operations.
In Texas, tech and IT businesses run 78% below the state average, reflecting low-risk office environments and limited physical exposure. Construction carries costs 181% above that benchmark, driven by jobsite hazards, equipment use and higher injury potential. Where your business falls between those endpoints determines much of your premium.
Texas-Specific General Liability Insurance Cost Factors
Texas businesses also face state-level conditions that shape pricing on top of industrywide factors. These localized forces interact with operational risk to set where premiums land within the broader cost range.

Texas' Legal and Litigation Environment
Texas ranks among four states that collectively produce half of the nation's nuclear verdicts (jury awards exceeding $10 million), according to the U.S. Chamber of Commerce. Social inflation drives claim costs beyond economic inflation through third-party litigation funding and anti-corporate jury sentiment. Gulf Coast regions show higher litigation rates, compounding unpredictable verdict risk and pushing costs up through larger settlements.

Texas' Weather and Natural Disasters
Hurricane Harvey caused $125 billion in damage in 2017, making it the second-costliest U.S. hurricane, according to NOAA. Texas experiences the nation's highest tornado frequency, widespread hailstorms and recurring floods. Weather events create premises liability when storm-damaged walkways or structures cause customer injuries. Insurers price these risks through regional adjustments, with Gulf Coast and tornado-prone areas carrying higher baseline rates.

Texas' Economic and Construction Factors
Construction materials costs rose significantly post-pandemic, and labor wages also increased substantially from 2021 to 2023. Higher material and labor costs directly affect general liability settlements as insurers pay current market rates for property damage repairs and incorporate rising medical costs into bodily injury settlements. These escalating costs drive claim severity up across both property damage and bodily injury categories.

Texas' Geographic and Regional Variations
Urban density creates pricing tiers, with downtown Dallas and Houston businesses paying 10% to 15% more than suburban counterparts. The 14 Gulf Coast counties in TWIA's service area carry compounded hurricane exposure and higher litigation rates. Local crime rates, population density and weather patterns create additional regional variation. Insurers segment Texas into pricing zones that push costs up in high-density urban cores and coastal regions while trending down in suburban and rural locations.

Texas' Industry Mix and Economic Diversity
Texas' concentrated oil and gas sector carries high-risk operations with hazardous materials and heavy equipment, pushing premiums higher. Construction activity varies regionally, affecting the frequency of contractor liability claims. The growing technology sector and professional services pull costs in the opposite direction with minimal physical hazards.
Get a TX General Liability Insurance Cost Estimate
Based on your industry and number of employees, you can estimate your premium using the general liability insurance calculator below. Estimates assume a standard policy with $1 million in coverage per occurrence and a $2 million aggregate limit. You can also select Get Quotes to be matched with insurers that may fit your business based on the information you provide.
Texas General Liability Cost Estimate Calculator
Select General Industry
Select Employee Count
Monthly rate estimate—
Select General Industry
Monthly rate estimate—
Select Employee Count
How to Lower General Liability Insurance Costs Without Sacrificing Coverage
Lower general liability costs come from tactical changes you can make now and longer-term investments in risk controls that build over time. Neither requires downgrading your protection.
Texas businesses looking to reduce premiums should start by understanding what carriers in the state charge for comparable coverage. Explore cheap general liability insurance in Texas to see which providers price competitively for your profile.
Quick General Liability Cost Lowering Methods
These adjustments lower expenses while keeping protection aligned to your actual contract requirements and operational risks.
 Provide clean, accurate underwriting information
Insurers calculate premiums by matching your business to industry risk tables based on classification codes, annual revenue and employee count. Austin tech consultants carry fundamentally different liability exposure than Houston construction firms or Dallas health care practices, which is why accurate reporting matters for getting appropriate rates. Understating revenue or employee count might seem like a way to lower premiums, but insurers recalculate retroactively when they discover discrepancies during audits, adding penalty charges that exceed any initial savings.

Compare multiple insurers
General liability pricing varies dramatically between carriers because each insurer uses different claims data and risk models to evaluate the same business. Houston contractors might receive quotes ranging from $280 to $420 monthly depending on how each carrier prices Gulf Coast construction exposure, a 50% spread across the pricing distribution. Regional insurers often understand Texas-specific risks better than national carriers, while specialty insurers focus on particular industries. Comparing business insurance quotes from four to five insurers helps identify the most competitive pricing for your risk profile.
 Bundle general liability into a business owner's policy (BOP)
Businesses that need commercial property insurance for equipment, inventory or furnishings, like a San Antonio restaurant, can reduce total insurance costs 15% to 25% by bundling property and liability coverage into a business owner's policy instead of purchasing separately. Compare BOP costs for your business against separate policies to confirm the savings apply to your coverage needs.
 Pay annually instead of monthly
Prepaying your annual premium eliminates monthly billing fees and earns 5% to 10% discounts that insurers offer for reducing their administrative costs. This strategy works best for businesses with predictable cash flow like Dallas professional services firms and Austin tech companies that can allocate funds without disrupting operations. Seasonal businesses like Gulf Coast tourism operators might be better off paying monthly to preserve working capital during slower periods.
 Increase your deductible (if you can afford it)
Higher deductibles reduce monthly premiums because you're assuming more financial responsibility for the first portion of each claim, lowering the insurer's risk exposure. Raising your deductible from $500 to $2,500 cuts premiums 20% to 30%, but only makes financial sense if you can cover that out-of-pocket expense when claims occur. Houston energy companies and San Antonio professional services firms with strong balance sheets and low claim frequency benefit most. Businesses with tight margins or frequent small claims should keep lower deductibles to avoid unpredictable cash drains.
 Adjust your coverage limits
Many Texas businesses carry $2 million/$4 million aggregate limits because that's the industry standard, but you only need general liability insurance high enough to satisfy your actual contract requirements and protect business assets. El Paso manufacturers whose clients require $1 million/$2 million coverage overpay by 15% to 25% when they purchase higher limits unnecessarily. Review your contracts to identify the minimum required coverage, then balance that against your revenue and asset exposure to avoid paying for protection you don't need.
Read More: How Much General Liability Insurance Do You Need?
Long-Term General Liability Cost Lowering Methods
Clean claims records and verified safety programs produce savings that grow with each renewal. These strategies take more time but deliver reductions that one-time adjustments can't match.
General Liability Insurance Cost in Texas: Bottom Line
Texas general liability costs center on $122 per month, but where your business lands depends on a handful of variables that either push premiums above or below that benchmark. Three questions pinpoint what drives your rate:
- Where does your industry sit in the state's cost spectrum? Construction and health care cluster at the top of the distribution while tech, consulting and professional services pay a fraction of the average. Your industry classification sets the starting point before anything else.
- Which Texas-specific factors shape your baseline? The state's nuclear verdict exposure, Gulf Coast hurricane risk, rising construction costs and urban density all add localized pricing pressure that separates Texas from neighboring states. Businesses in Houston and Dallas face different risk adjustments than those in suburban or rural locations.
- What can you control versus what is fixed? Employee count and industry classification are hard to change, but carrier selection, deductible levels, coverage limits and payment terms are decisions you make. The gap between the least and most expensive quote for the same Texas business can exceed 50%, which means shopping is the fastest lever available.
The state average is a reference point. Your quoted rate reflects the specific combination of industry, size, location and coverage decisions that define your business.
About Angelique Palenzuela-Cruz

Angelique Palenzuela-Cruz is a Business Insurance Content Writer at MoneyGeek, where she specializes in general liability, workers’ compensation and professional liability insurance. Her work helps small business owners understand how these policies apply to coverage, including risks like customer injuries, employee injuries, professional mistakes, client contract terms and industry-specific coverage requirements.
She primarily covers service-based businesses where liability and employee coverage decisions are especially important, including cleaning, consulting, beauty and wellness, childcare, education, fitness, food service, pet care, repair and maintenance, and other professional services.
Before joining MoneyGeek, Angelique spent nearly 12 years at Guthrie-Jensen Consultants, one of Southeast Asia’s largest management training firms, where she advanced from Training Consultant to Managing Consultant. In that role, she worked with business clients to assess operational needs, develop training programs and present performance analyses to executive decision-makers. She also helped establish Gladwin Training Consultancy, where she served in learning solutions and client service roles.
Her background gives her practical context for writing about how businesses operate, manage client expectations, structure teams and make risk decisions. At MoneyGeek, she applies that experience to business insurance content, connecting coverage to actual business needs.
LinkedIn: linkedin.com/in/ma-angela-cruz
Email Contact: angelique.palenzuela@moneygeek.com