


Jump to the section that meets your needs best below:
Average Restaurant Business Insurance Cost (2026 Report)
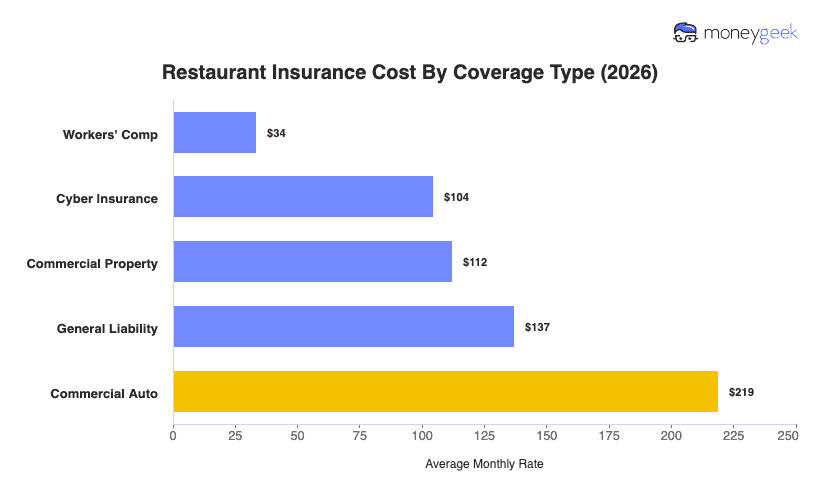
Restaurant insurance costs about $283 per month for a recommended bundle with general liability, commercial property and workers’ comp for one employee. The services you offer, your kitchen equipment, staffing, online orders and other operational details can affect your coverage needs, with individual policies ranging from $33 to $219 per month.
If you’re ready to get a quote, MoneyGeek can connect you with a restaurant business insurer that fits your coverage needs with our matching tool below.
Select state
Updated: September 9, 2026
Advertising & Editorial Disclosure
How Much Does Restaurant Business Insurance Cost?
Food business insurance costs for restaurants range from about $249 to $859 per month. The bundle that best fits your coverage needs determines where you fall within that range. For most full-service restaurants, the recommended bundle includes general liability, commercial property and workers' compensation for one employee, averaging $283 per month. Restaurants with no employees often pay less. Adding staff raises the premium, since workers' comp costs about $34 per employee per month.
Featured Partner

The Hartford
- The Hartford insures cafes, coffee shops, full-service restaurants and caterers.
- Small businesses have been insured by The Hartford since 1810.
- Liquor liability, food spoilage and equipment breakdown are among The Hartford's restaurant add-ons.
- The National Fire Protection Association counts more than 9,000 structure fires a year at U.S. eating and drinking establishments. The Hartford covers that risk with property and business income coverage.
On The Hartford's site
*MoneyGeek featured partner. Editorial rankings below are independent of this placement. Rates, rankings and savings comparisons are based on MoneyGeek's independent research and Hartford-reported data as of 2026. Figures are estimates and averages, not a guarantee of any individual quote, premium or discount.
Restaurants that keep refrigerated inventory or depend on walk-in coolers, freezers, ovens and other key equipment should add food spoilage and equipment breakdown coverage. That brings the full-service operations bundle to about $463 per month. Restaurants that also own a vehicle for deliveries, catering, or supply runs and rely on online orders or digital payments usually need the expanded bundle. That coverage costs about $859 per month.
These figures are modeled averages of quotes for restaurants with one to four employees across all 50 states, before discounts. Your actual premium depends on your state, claims history and coverage limits. Use this range as a starting point when you review your own quotes.
Here's how the bundles compare:
Minimum Starting Bundle | General liability, commercial property | $249 | $2,991 |
Recommended Bundle | General liability, commercial property, workers’ comp for one employee | $283 | $3,394 |
Full-Service Operations Bundle | General liability, commercial property, workers’ comp for one employee, equipment breakdown, food spoilage | $463 | $5,554 |
Expanded Coverage Bundle | General liability, commercial property, workers’ comp for one employee, equipment breakdown, food spoilage, cyber insurance, commercial auto, liquor liability | $859 | $10,308 |
To estimate restaurant insurance costs, we used quotes from 10 major U.S. commercial insurance providers and modeled premiums for standardized full-service restaurant across all 50 states and Washington, D.C. The model includes different staffing levels, from owner-operated restaurants to larger ones with multiple employees.
To get the figures in this guides, we modeled restaurant premiums, not live quotes. We summarized the data in three ways:
National benchmark average: This figure gives you a broad reference point for full-service restaurant insurance costs. It reflects standardized restaurant profiles with one to four employees, industry-recommended policy limits and modeled results from every state and Washington, D.C.
State averages: To show how location changes cost, we compared the same base restaurant profile across each state and Washington, D.C. This keeps the business profile consistent while isolating the effect of geography.
Bundle averages: Package costs were built from the modeled prices of individual policies from our study and researched rates for specialized coverage. For BOP estimates, we combined general liability and commercial property, then applied a 10% bundling discount to reflect how BOPs are typically priced below separate policies.
Specialized restaurant policy costs are handled separately. Coverage types such as liquor liability, food spoilage, business interruption, equipment breakdown, crime insurance, EPLI and hired and non-owned auto are based on external research, not our modeled restaurant dataset. We included these ranges to help estimate what add-on coverage may cost when those risks apply to your restaurant.
See our full business insurance methodology.
Get Restaurant Business Insurance Cost Estimates
Our restaurant business insurance cost calculator below gives you more personalized estimates so you can accurately compare rates. After getting a benchmark, you can request for a quote from your the providers MoneyGeek matches you with based on the business details you enter.
Get Restaurant Insurance Cost Estimates
Select Coverage Type
Select State
Select Employee Count
Select vehicle_type
Monthly Rate Estimate—
Select Coverage Type
Monthly Rate Estimate—
Select State
Select Employee Count
Select vehicle_type
Factors Affecting Restaurant Business Insurance Costs
Serving customers in a full-service restaurant involves more than food and tables, and each part of your operation can affect your premium. Some factors are specific to how your restaurant runs, such as your dining room, kitchen equipment, food storage, staff, payment systems and extra services. Others are more general and apply to any business, such as your location and claims history. I’ve explained these below:
 Service style and guest experience
Insurers price your service style based on how much guests move through your space and how long they linger. Table service, a waiting area, bar seating, outdoor dining and busy dinner rushes all raise your rate, since spills, falls, burns and property damage become more likely. A smaller reservation-only restaurant with fewer tables and shorter hours usually carries a lower risk profile.
 Kitchen setup and cooking intensity
A simpler kitchen, with basic prep, fewer high-heat cooking methods and lower-cost equipment, usually costs less to insure, since there's a lower risk of fire, equipment failure, food spoilage or property damage. Complexity pushes your rate higher, especially with fryers, grills, open flames, walk-in coolers, freezers or high-value ingredients.
 Alcohol service and bar operations
Alcohol adds risk insurers price separately. Overserved or intoxicated customers can cause fights, falls, property damage or accidents after they leave, so premiums climb when your restaurant serves cocktails, has bar seating, runs happy hour, stays open late or hosts private events. Restaurants that serve little or no alcohol and close earlier usually cost less to cover.
 Restaurant buildout and physical space
Your physical space affects your property coverage cost. Fewer owned improvements, standard fixtures and lower-cost equipment keep premiums down, while a large dining room, custom kitchen buildout, outdoor seating or leasehold improvements push them up, since a more customized space costs more to repair or replace after a covered loss.
 Off-premises operations
Delivery, catering, pop-ups and regular supply runs extend your risk beyond the dining room and kitchen. Rates go up when employees drive, transport food, carry equipment or serve customers off-site. A restaurant that serves guests only at its own location usually has fewer off-premises risks and spends less on insurance.
How to Lower Restaurant Business Insurance Costs
There are several ways to lower your restaurant business insurance rates. Some methods affect your premium immediately, and you could even find more affordable coverage before you purchase or renew your policy. Others take time to take hold but also lead to long-term savings. The list I provided below covers both:
 Compare quotes using the same coverage limits
Compare business insurance quotes from at least three insurers with the same coverage types, limits and deductibles to see which provider is actually cheaper and avoid mistaking a lower-coverage quote for a better deal. Review more than the price, including exclusions, endorsements, sublimits and whether the policy covers the restaurant activities you actually perform. Then compare service factors like claims handling, certificate turnaround and customer support so you can choose the best overall value, not just the lowest price.
 Right-size your coverage
Check whether your policy still matches how your restaurant runs today. If you no longer deliver, have stopped alcohol service, have cut back on catering or have sold equipment, make sure your coverage and limits reflect those changes. You could lower your premium by removing outdated protections. Keep coverage for risks that remain part of your service.
 Increase your deductible strategically
Identify which policies in your bundle have deductibles, then decide where a higher one is worth it. You may be able to raise your deductible for property- or equipment-related coverage if your restaurant has sufficient cash to cover smaller repairs or losses. Be careful with coverage tied to expensive disruptions, since paying a larger share of losses from walk-in cooler failures, fire damage or major kitchen repairs could create cash flow problems for your restaurant.
 Bundle policies with the same provider
Bundling can lower your total cost and make your coverage easier to manage. For restaurants, a business owner's policy is a solid starting point, since it covers guest injuries in the dining room as well as damage to kitchen equipment, furniture, fixtures and inventory. Some providers may also offer discounts if you add workers' comp, cyber or other policies with the same carrier.
 Invest in risk management practices
Implementing safety procedures can lower your costs over time, since insurers consider your claims history when pricing coverage. For your restaurant, that means preventing incidents most likely to lead to claims, such as guest and employee injuries, kitchen fires, spoiled food and alcohol-related incidents. A few practices worth putting in place:
- Check your dining areas, restrooms and entryways during service so your staff can quickly handle spills, wet floors and tripping hazards.
- Schedule hood cleaning, grease trap maintenance and equipment checks to reduce your restaurant's risks of kitchen fires and equipment failures.
- Log cooler temperatures and food storage checks so you can catch refrigeration problems before food spoils.
- Train your staff on alcohol service, delivery procedures and safe lifting to reduce customer, driver and employee injury claims.
Restaurant Business Insurance Cost: Bottom Line
The recommended restaurant business insurance bundle averages about $283 per month, but that figure works best as a reference point. Your actual rate can shift based on your restaurant type, employee count, state and coverage mix.
To help you put context into any quote you get, I suggest you start with these three questions:
- How do you compare to similar restaurants? Compare your quote against rates for restaurants with similar coverage and location. A quote near the average doesn't automatically fit your situation: a leaner setup should cost less, and a more complex one should cost more.
- Is your quote consistent with your risk profile? A quote far above or below the typical range deserves a closer look. The gap may come from limits, exclusions, claims history, bundled coverage or risks the average doesn't capture.
- Which cost drivers apply to your business? Not every factor matters equally for every restaurant. A full-service restaurant with table service and alcohol costs more to insure than a takeout-focused restaurant with fewer on-site exposures.
What matters isn't whether your quote lands above or below average. It's understanding what's driving the difference. Use this page as context for reading your own quote, not as the exact price you should expect to pay.
About Angelique Palenzuela-Cruz

Angelique Palenzuela-Cruz is a Business Insurance Content Writer at MoneyGeek, where she specializes in general liability, workers’ compensation and professional liability insurance. Her work helps small business owners understand how these policies apply to coverage, including risks like customer injuries, employee injuries, professional mistakes, client contract terms and industry-specific coverage requirements.
She primarily covers service-based businesses where liability and employee coverage decisions are especially important, including cleaning, consulting, beauty and wellness, childcare, education, fitness, food service, pet care, repair and maintenance, and other professional services.
Before joining MoneyGeek, Angelique spent nearly 12 years at Guthrie-Jensen Consultants, one of Southeast Asia’s largest management training firms, where she advanced from Training Consultant to Managing Consultant. In that role, she worked with business clients to assess operational needs, develop training programs and present performance analyses to executive decision-makers. She also helped establish Gladwin Training Consultancy, where she served in learning solutions and client service roles.
Her background gives her practical context for writing about how businesses operate, manage client expectations, structure teams and make risk decisions. At MoneyGeek, she applies that experience to business insurance content, connecting coverage to actual business needs.
LinkedIn: linkedin.com/in/ma-angela-cruz
Email Contact: angelique.palenzuela@moneygeek.com