




Jump to the section that meets your needs best:
Average Workers' Comp Insurance Cost (2026 Report)
Average workers' comp insurance costs range from $16 to $343 per employee monthly. Rates primarily vary by industry, business size and location.
If you're ready to buy, get matched to the workers' comp fit for your business with our matching tool below.
Select state
Updated: September 16, 2026
Advertising & Editorial Disclosure
Featured Partner

The Hartford
- The Hartford's own customers with payroll under $300,000 average $81 a month for a full workers' compensation policy. Some start as low as $13.
- Medical costs and testing after an employee is stuck by a needle on the job are covered under The Hartford's workers' compensation.
- Injured employees get access to more than 1 million providers experienced in workplace injuries and more than 65,000 U.S. pharmacies through The Hartford.
- The Hartford bills pay-as-you-go coverage on payroll as reported, not an estimate.
On The Hartford's site
*MoneyGeek featured partner. Editorial rankings below are independent of this placement. Rates, rankings and savings comparisons are based on MoneyGeek's independent research and Hartford-reported data as of 2026. Figures are estimates and averages, not a guarantee of any individual quote, premium or discount.
How Much Does Workers' Comp Insurance Cost?
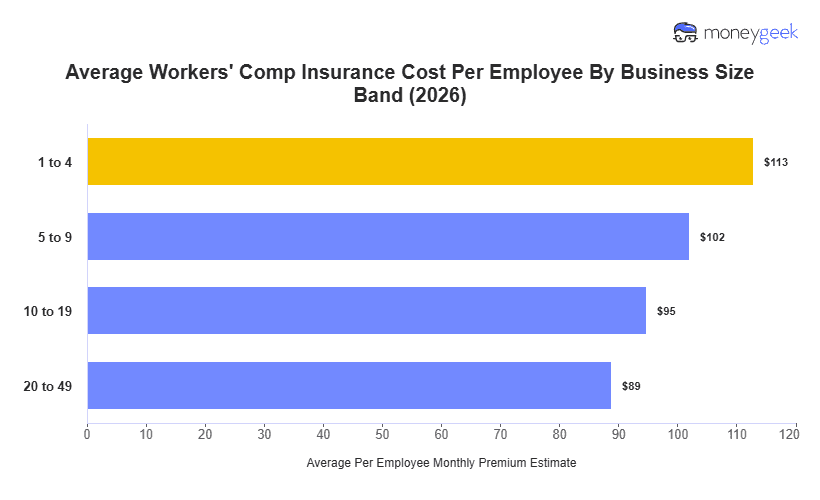
Workers' comp insurance costs an average of $113 per employee monthly ($1,354 per employee annually) for businesses with one to four employees across 408 industries and 46 states plus Washington, D.C.
This is a benchmark, not a quote. Insurers adjust workers' comp rates and all small business insurance costs based on industry risk (how often and how severely injuries occur), business size (total payroll) and location (state-specific regulations).
MoneyGeek analyzed quote data from major U.S. small business insurance providers and modeled standardized premium estimates across common business profiles. These modeled results provide a consistent national benchmark and compare premiums by business size, industry and location.
Dataset Scope and Assumptions
Our cost modeling uses standardized inputs for consistent comparisons.
- Providers analyzed: 10 major insurance providers
- Industries covered: 408 industries, each assigned its most common workers' comp classification code for representative pricing
- Geography: 46 competitive states plus Washington, D.C. (excludes monopolistic states: North Dakota, Ohio, Washington and Wyoming)
- Employee count bands: zero, one to four, five to nine, 10 to 19 and 20 to 49 employees (representing ~95% of small businesses)
- Policy baseline: standard workers' compensation policy with state-mandated benefit levels
- Total estimates modeled: just over 1 million standardized pricing estimates
We incorporated modeled average payroll across all combinations of states, industry and employee counts to improve per-employee pricing accuracy. We used data from these sources for our cost factors:
- CBP (for employee size class density by state + NAICS)
- QCEW (for wage/payroll intensity by industry + geography)
- Economic Census / SUSB (for receipts/output intensity by industry)
- Calibrated against:
- Private comp databases
- NCCI class code rate filings
- State rating bureau data
How We Calculated Average Workers' Comp Costs
Our published averages represent modeled premiums for standardized business profiles, aggregated in two ways:
- National benchmark average – The national average cost reflects the modeled premium for a standardized one to four-employee small business across all industries and states in our dataset, calculated per employee.
- Segment averages – We calculated average modeled premiums for our national base profile, isolating these variables:
- Employee count (business size ranges)
- General industry categories (each assigned the most common workers' comp classification code for that industry)
- States (46 competitive states plus Washington, D.C.)
Segment averages were produced by aggregating modeled pricing trends across the full dataset so readers can compare how premiums shift across business types and regions on a per-employee basis.
Read our full methodology.
Get Workers' Comp Insurance Cost Estimates
You can use our workers' comp insurance calculator below to get a more accurate estimate of your costs.
Worker's Comp Insurance Cost Estimate Calculator
Select your state and industry to view average business insurance premiums in your area. Rates are calculated based on a business with 5 employees and $500,000 in annual revenue.
Select General Industry
Select State
Select Employee Count
Average monthly per employee rate—
Select General Industry
Average monthly per employee rate—
Select State
Select Employee Count
What Factors Affect Workers' Comp Insurance Costs?
Three baseline factors drive workers' comp pricing: industry classification, geographical location and business size. Insurers use these to estimate how often workplace injuries occur and how costly they are. Business size reflects payroll exposure, location captures state benefit mandates and medical costs, and industry signals the physical risk of the work.
We used the same approach in our cost modeling to estimate rates. Each driver creates measurable cost differences.
 Industry classification
Industry classification is the largest baseline pricing driver for workers' comp coverage because it reflects injury risk. Insurers assess how physical the work is, what equipment or hazards are involved, and how frequently and severely injuries occur in each job type. A desk-based role carries lower claim costs than work involving heavy machinery, heights or repetitive physical strain.
In our analysis of 408 industries, workers' comp premiums range from 86% lower than average for Beauty, Body and Wellness Services to 204% higher than average for Transportation and Logistics.
 Geographic location
Each state sets its own benefit levels, medical fee schedules and regulatory requirements for workers' comp coverage. Geographic location is the second strongest driver for workers' comp premiums. States with higher medical costs, more generous wage replacement formulas or longer claim duration patterns produce higher premiums. Legal environments that favor broader coverage interpretations or larger settlements also push costs upward.
Premiums across 46 competitive states, plus Washington, D.C., range from 44% below average in Indiana to 138% above average in New York.
 Business size
Business size is the third baseline driver and affects workers' comp pricing differently than other coverage types. While total premiums rise with more employees, per-employee costs usually decline because larger businesses qualify for experience rating, gain administrative cost advantages and maintain stronger safety programs that reduce claim frequency.
Ninety-five percent of small businesses have 49 or fewer employees. Per-employee costs range from the baseline rate for one to four employees to 21% lower for businesses with 20 to 49 employees.
How to Lower Workers' Comp Insurance Costs Without Sacrificing Coverage
Business size, industry classification and location set the baseline, but they don't lock in your final quote. Insurers adjust rates based on controllable factors like coverage design, risk management and underwriting information.
Methods that get you cheaper workers' comp rates at quoting or renewal, plus operational changes that influence future pricing include the following.
Quick Workers' Comp Cost Lowering Methods
Use these methods at quoting or renewal to reduce per-employee costs:
 Verify employee classification codes
Insurers price workers' comp using specific job classification codes that reflect injury risk. Misclassified employees (assigning office staff to a higher-risk code, for example) inflate premiums unnecessarily. Class code assignments should be reviewed with the agent to confirm each employee is placed in the most accurate category for their actual duties.
 Shop multiple carriers at renewal
Workers' comp pricing varies substantially between insurers for the same business profile. Carriers apply different risk models and carry different appetites for specific industries or claim histories. Pulling commercial insurance quotes from at least three insurers 60 to 90 days before renewal allows for rate comparison using identical coverage specifications and payroll projections.
 Confirm accurate payroll reporting
Premiums are calculated based on payroll figures, so overestimating projected annual payroll raises costs immediately. Precise payroll data by employee class code should be provided at quoting, and participation in the end-of-policy audit allows premiums to be adjusted based on actual wages paid rather than estimates.
 Ask about discounts
Many insurers offer immediate premium reductions for qualifying businesses. Common discounts include drug-free workplace programs, safety committee participation and experience modification credits for favorable claims history. The agent should be asked which discounts the business currently qualifies for and what documentation is required.
 Bundle workers' comp with other policies
Insurers often reduce rates when businesses purchase multiple coverage types from the same carrier. Bundling workers' comp with general liability or commercial property can trigger multi-policy discounts. Combined quotes should be pulled to compare bundled pricing against separate policies from different carriers.
 Review and update your experience modification rate
The experience mod reflects the business's claims history compared to similar businesses and directly multiplies the premium. When the mod is above 1.0, the calculation should be reviewed for errors in claims data or misclassified incidents. The state's rating bureau should be contacted to dispute inaccuracies that may be inflating the mod.
Long-Term Workers' Comp Cost Lowering Methods
You can decrease claim costs and improve renewal pricing over time.
Workers' Comp Insurance Cost: Bottom Line
Workers' comp costs vary because insurers estimate claim frequency and severity based on your industry classification, business size and geographic location. The national average of $113 per employee monthly is a benchmark, not a quote for your situation.
This report shows where you fall, not your exact cost.
Three questions help you assess your position:
- Where does your business fall relative to the benchmark? (Compare your industry, employee count and state to the distributions above.)
- Which baseline factors drive the largest differences? (Industry classification creates the widest spread, followed by state and size.)
- What can you control at quoting and renewal? (Classification accuracy, payroll reporting, discounts and claims management practices.)
These questions identify which combination of factors influences your pricing, not just where you stand against the average.
If you want to learn about other business insurance costs
About Angelique Palenzuela-Cruz

Angelique Palenzuela-Cruz is a Business Insurance Content Writer at MoneyGeek, where she specializes in general liability, workers’ compensation and professional liability insurance. Her work helps small business owners understand how these policies apply to coverage, including risks like customer injuries, employee injuries, professional mistakes, client contract terms and industry-specific coverage requirements.
She primarily covers service-based businesses where liability and employee coverage decisions are especially important, including cleaning, consulting, beauty and wellness, childcare, education, fitness, food service, pet care, repair and maintenance, and other professional services.
Before joining MoneyGeek, Angelique spent nearly 12 years at Guthrie-Jensen Consultants, one of Southeast Asia’s largest management training firms, where she advanced from Training Consultant to Managing Consultant. In that role, she worked with business clients to assess operational needs, develop training programs and present performance analyses to executive decision-makers. She also helped establish Gladwin Training Consultancy, where she served in learning solutions and client service roles.
Her background gives her practical context for writing about how businesses operate, manage client expectations, structure teams and make risk decisions. At MoneyGeek, she applies that experience to business insurance content, connecting coverage to actual business needs.
LinkedIn: linkedin.com/in/ma-angela-cruz
Email Contact: angelique.palenzuela@moneygeek.com