




Small businesses with one to four employees pay $123 per month ($1,474 annually) on average for general liability insurance with $1 million per occurrence/$2 million aggregate limits. This average reflects analysis across 408 industries and all 50 states, plus Washington, D.C.
Average General Liability Insurance Cost (2026 Report)
Average general liability insurance costs range from $27 to $2,298 monthly and your rate will vary based on your industry, location and business size.
Learn more about general liability policy costs, how they vary, why they vary and how to use this information to save.
If you're ready to buy, get matched to the best general liability insurance provider for your business below.
Select state
Updated: August 24, 2026
Advertising & Editorial Disclosure
How Much Does General Liability Insurance Cost?
Featured Partner

The Hartford
- The Hartford is MoneyGeek's cheapest general liability insurer for 2026, at $102 a month, 17% below the $123 national average.
- AM Best rates The Hartford A+ (Superior) for financial strength.
- Small business customers at The Hartford pay about $69 a month for a $1 million general liability policy.
- The Hartford's small business coverage is available in 48 states, not including Alaska or Hawaii.
*MoneyGeek featured partner. Editorial rankings below are independent of this placement. Rates, rankings and savings comparisons are based on MoneyGeek's independent research and Hartford-reported data as of 2026. Figures are estimates and averages, not a guarantee of any individual quote, premium or discount.
This national benchmark doesn't guarantee your price. Small business insurance costs vary based on industry risk level, location and business size, even for identical coverage limits.
To estimate average general liability insurance costs, we analyzed quote data from major U.S. small business insurance providers and modeled standardized premium estimates across common business profiles. These modeled results are designed to provide a consistent national benchmark and show how premiums vary by key baseline factors including business size, industry and location.
Dataset Scope and Assumptions
Our cost modeling uses standardized inputs for consistent comparisons across businesses.
- Providers analyzed: 10 major insurance providers
- Industries covered: 408 industries
- Geography: all U.S. states (including Washington, D.C.)
- Employee count bands: zero, one to four, five to nine, 10 to 19 and 20 to 49 employees (representing ~95% of small businesses)
- Policy baseline: standard general liability policy with $1 million per occurrence / $2 million aggregate limits
- Total estimates modeled: just over 1 million standardized pricing estimates
We also incorporated modeled average revenue and payroll personalized across all combinations of states, industry and employee counts to improve the accuracy of pricing. To model these assumptions against our cost factors, we used data from these sources:
- CBP (for employee size class density by state + NAICS)
- QCEW (for wage/payroll intensity by industry + geography)
- Economic Census / SUSB (for receipts/output intensity by industry)
- Calibrated against:
- Private comp databases
- IRS SOI totals
How We Calculated Average General Liability Costs
Our published averages represent modeled premiums for standardized business profiles and were aggregated in two ways:
- National benchmark average: The national average cost reflects the modeled premium for a standardized one to four-employee small business across all industries and states included in our dataset for a standard general liability policy.
- Segment averages: To show how costs vary, we calculated average modeled premiums for our national base profile and isolated for variables, including:
- Employee count (business size ranges)
- General industry categories
- States (including Washington, D.C.)
Segment averages were produced by aggregating modeled pricing trends across the full dataset so readers can compare how premiums shift across business types and regions.
If you want a more personalized estimate, you can use our general liability insurance cost calculator below.
General Liability Insurance Cost Estimate Calculator
Select your state, industry and employee count range to get average general liability insurance estimate for your business. Rates are calculated for a standard $1 million per occurrence and $2 million aggregate policy.
Select General Industry
Select State
Select Employee Count
Average monthly rate—
Select General Industry
Average monthly rate—
Select State
Select Employee Count
What Factors Affect General Liability Insurance Costs?
General liability pricing varies based on three core factors: business size, geographic location and industry classification. These variables explain most premium differences across small businesses because they capture key exposures insurers price: claim frequency, severity potential, operational setup and business activity level.
Premiums in our cost modeling use these three baseline drivers. The sections below explain how each influences general liability cost and how pricing shifts across businesses.
 Business size
Business size is the strongest baseline pricing driver for general liability insurance because it directly correlates with total exposure. Larger businesses have more opportunities for third-party injury and property damage through higher work volume, more customer interactions and more employees.
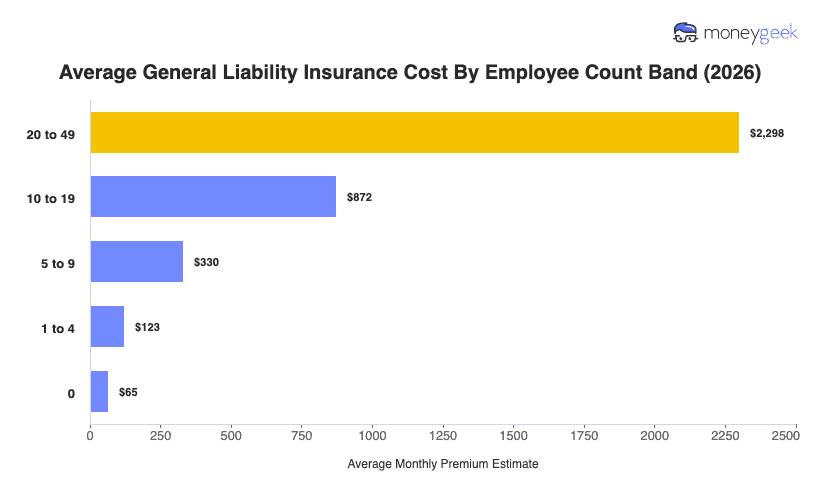
For employee count ranges representing 95% of small businesses, general liability premiums increase as business size grows. Pricing ranges from 47% lower than average for sole proprietors to 1,768% higher than average for businesses with 20 to 49 employees.
 Industry classification
Industry classification is the second strongest baseline pricing driver because claim frequency and severity vary widely across business types. Industry class codes account for exposure factors including jobsite work, customer foot traffic, equipment use, work on customer property, subcontractor oversight and product liability.
Across 408 industries, general liability premiums vary by industry from 78% below average to 174% above average. Tech/IT represents the lowest-risk category, while Contracting and Construction represents the highest risk.
 Geographic location
Geographic location is the third major baseline pricing driver because it affects claim costs, even for identical businesses with the same coverage limits. Insurers price general liability differently by state to reflect local differences in medical costs, repair and replacement costs, legal environment and claim settlement patterns.
General liability premiums vary by state from 29% lower than average in West Virginia to 54% higher than average in California.
Average General Liability Insurance Costs by Business Size
Solo operators pay $65 monthly for general liability insurance because they lack staff who could cause third-party injuries. Costs climb sharply as teams grow. A shift from one to four employees to five to nine employees costs over $200 more per month (168% higher) on average because more employees create more liability claim opportunities.
You can see how general liability insurance costs scale with team size below.
Average General Liability Insurance Costs by Industry
Industry is the second largest source of premium variation in general liability pricing due to its direct relation to operation structure, risk exposure and risk magnitude. Average monthly premiums range from $27 for Tech/IT businesses to $337 for Construction and Contracting for identical base coverage limits.
The 25 major industry categories fall into three cost tiers based on their difference from the national average:
- Low-cost industries (20%+ below national average): 14 of 25 industries (56%)
- Mid-cost industries (within ±20% of national average): nine of 25 industries (36%)
- High-cost industries (20%+ above national average): two of 25 industries (8%)
Ninety-two percent of industries fall close to or below the national average. Only 8% exceed average costs by over 20%, including Health Care and Contracting/Construction, which are 70% or more above the national benchmark.
The table below shows general liability costs by industry category. Pricing varies widely within each category based on subindustry risk level, employee count and state.
Data filtered by:
Select
| Agriculture & Natural Resources | $100 | $1,202 | -18% | 17 |
| Arts, Media & Entertainment | $38 | $456 | -69% | 4 |
| Beauty, Body & Wellness Services | $40 | $483 | -67% | 5 |
| Childcare Services | $128 | $1,530 | 4% | 23 |
| Cleaning Services | $100 | $1,199 | -19% | 16 |
| Construction & Contracting | $337 | $4,041 | 174% | 25 |
| Consulting Services | $32 | $390 | -74% | 3 |
| Education | $48 | $576 | -61% | 7 |
| Financial Services | $42 | $505 | -66% | 6 |
| Fitness Services | $104 | $1,244 | -16% | 18 |
| Food & Beverage | $126 | $1,516 | 3% | 22 |
| Healthcare & Medical | $209 | $2,512 | 70% | 24 |
| Hospitality, Travel & Tourism | $107 | $1,282 | -13% | 19 |
| Manufacturing | $69 | $833 | -43% | 10 |
| Marketing & Communications | $32 | $386 | -74% | 2 |
| Nonprofit & Associations | $57 | $682 | -54% | 9 |
| Other Professional Services | $77 | $919 | -38% | 13 |
| Pet Care Services | $76 | $908 | -38% | 11 |
| Real Estate & Property Services | $48 | $578 | -61% | 8 |
| Recreation and Sports | $92 | $1,104 | -25% | 15 |
| Repair & Maintenance | $76 | $908 | -38% | 12 |
| Retail & Product Rental | $110 | $1,320 | -10% | 21 |
| Tech/IT | $27 | $328 | -78% | 1 |
| Transportation & Logistics | $83 | $999 | -32% | 14 |
| Wholesale & Distribution | $107 | $1,285 | -13% | 20 |
Use these resources to explore costs for your industry.




Average General Liability Insurance Costs by State
The state a business is located in is the third most influential driver for general liability insurance pricing because local medical costs, repair expenses, litigation activity and jury award patterns vary considerably. Average monthly premiums range from $87 in West Virginia to $190 in California for identical coverage limits.
States fall into three pricing tiers based on their difference from the national average:
- Lower-cost states (20%+ below national average): Nine states including Arkansas, Idaho, Iowa, Mississippi, Montana, North Dakota, South Carolina, South Dakota and West Virginia.
- Mid-cost states (within ±20% of national average): Thirty-two states including Alabama, Arizona, Colorado, Delaware, Florida, Georgia, Illinois, Indiana, Kansas, Kentucky, Louisiana, Maine, Michigan, Minnesota, Missouri, Nebraska, Nevada, New Hampshire, New Mexico, North Carolina, Ohio, Oklahoma, Oregon, Pennsylvania, Rhode Island, Tennessee, Texas, Utah, Vermont, Virginia, Wisconsin and Wyoming.
- Higher-cost states (20%+ above national average): Ten states including Alaska, California, Connecticut, Washington, D.C., Hawaii, Maryland, Massachusetts, New Jersey, New York and Washington.
State pricing distribution is more balanced than many expect. South Carolina and Iowa offer rates more than 20% below the national average. But businesses operating in New York or California pay premiums over 40% above average.
The table below shows general liability premiums by state.
Data filtered by:
Select
| Alabama | $100 | $1,198 | -19% | 10 |
| Alaska | $151 | $1,815 | 23% | 42 |
| Arizona | $122 | $1,470 | -0% | 30 |
| Arkansas | $99 | $1,185 | -20% | 9 |
| California | $190 | $2,284 | 55% | 51 |
| Colorado | $146 | $1,755 | 19% | 41 |
| Connecticut | $159 | $1,906 | 29% | 45 |
| Delaware | $131 | $1,567 | 6% | 34 |
| District of Columbia | $184 | $2,206 | 50% | 50 |
| Florida | $144 | $1,732 | 17% | 40 |
| Georgia | $121 | $1,451 | -2% | 27 |
| Hawaii | $159 | $1,913 | 30% | 46 |
| Idaho | $97 | $1,166 | -21% | 8 |
| Illinois | $141 | $1,690 | 15% | 39 |
| Indiana | $106 | $1,272 | -14% | 19 |
| Iowa | $95 | $1,135 | -23% | 4 |
| Kansas | $102 | $1,222 | -17% | 12 |
| Kentucky | $102 | $1,222 | -17% | 13 |
| Louisiana | $106 | $1,267 | -14% | 17 |
| Maine | $112 | $1,344 | -9% | 24 |
| Maryland | $155 | $1,859 | 26% | 44 |
| Massachusetts | $169 | $2,027 | 37% | 48 |
| Michigan | $115 | $1,381 | -6% | 26 |
| Minnesota | $129 | $1,552 | 5% | 32 |
| Mississippi | $89 | $1,074 | -27% | 2 |
| Missouri | $105 | $1,258 | -15% | 16 |
| Montana | $95 | $1,139 | -23% | 5 |
| Nebraska | $105 | $1,257 | -15% | 15 |
| Nevada | $131 | $1,572 | 7% | 35 |
| New Hampshire | $135 | $1,615 | 10% | 36 |
| New Jersey | $160 | $1,916 | 30% | 47 |
| New Mexico | $102 | $1,226 | -17% | 14 |
| New York | $180 | $2,157 | 46% | 49 |
| North Carolina | $112 | $1,341 | -9% | 23 |
| North Dakota | $96 | $1,156 | -22% | 7 |
| Ohio | $110 | $1,322 | -10% | 22 |
| Oklahoma | $100 | $1,201 | -19% | 11 |
| Oregon | $138 | $1,654 | 12% | 38 |
| Pennsylvania | $129 | $1,545 | 5% | 31 |
| Rhode Island | $130 | $1,556 | 6% | 33 |
| South Carolina | $96 | $1,154 | -22% | 6 |
| South Dakota | $91 | $1,088 | -26% | 3 |
| Tennessee | $112 | $1,346 | -9% | 25 |
| Texas | $122 | $1,462 | -1% | 28 |
| Utah | $110 | $1,319 | -11% | 21 |
| Vermont | $122 | $1,465 | -1% | 29 |
| Virginia | $136 | $1,627 | 10% | 37 |
| Washington | $153 | $1,834 | 24% | 43 |
| West Virginia | $87 | $1,041 | -29% | 1 |
| Wisconsin | $108 | $1,297 | -12% | 20 |
| Wyoming | $106 | $1,269 | -14% | 18 |
You can also dig deeper into our state specific resources below for more detailed information.



How to Lower General Liability Insurance Costs Without Sacrificing Coverage
General liability premiums vary most by business size, industry type and state, but these baseline factors don't determine your final quote alone. Businesses can reduce premiums by adjusting the pricing levers insurers use at quoting and renewal without leaving coverage gaps.
Below we've summarized the most effective ways to lower general liability costs:
Quick General Liability Cost Lowering Methods
We've ranked these immediate actions by financial risk.
 Provide clean, accurate underwriting information
Small differences in how your business is described can change your rating class and premium. Use the correct industry type, accurate revenue and employee counts, and a clear operations description. Insurers price your business using worst-case assumptions when information is unclear.
 Compare multiple insurers
Compare multiple business insurance quotes with identical coverage terms to find the best and most affordable provider.
 Bundle general liability into business owner's policies (BOP)
Bundling GL with other coverage (often commercial property in a BOP) reduces pricing versus buying separate policies and simplifies billing and renewals.
 Pay annually instead of monthly
Annual payments eliminate installment fees and often include small discounts since insurers receive their full premium upfront. This saves 5% to 10% compared to monthly payment plans, though you'll need to cover the full annual cost at policy inception.
 Increase your deductible (if you can afford it)
Higher deductibles lower premiums because you pay more of each claim yourself. Only increase your deductible if you can comfortably cover that amount out of pocket.
 Adjust your coverage limits
Premiums scale with limits. If your contracts allow it, lowering limits can reduce costs, but make sure your limits match your customer requirements and exposure.
Long-Term General Liability Cost Lowering Methods
Beyond immediate actions, these long-term strategies lower general liability premiums as your business grows.
General Liability Insurance Cost: Bottom Line
General liability insurance costs vary widely because insurers estimate your business's claim frequency and severity differently. Your premium is based primarily on business size, industry classification and location. Use the $123 monthly national average as a benchmark, not a prediction.
Apply this report by considering context, not a single price:
- Where do you fall compared to the average? (industry + state + employee count)
- What is driving your cost? (baseline risk vs. coverage design choices)
- What would meaningfully change your price? (limits, deductible, bundling and accurate underwriting details)
Frame your premium this way to evaluate quotes and coverage options based on whether they reflect your true risk profile, not just whether they're above or below the national average.
General Liability Insurance Cost: Next Steps
Choose the right provider type and narrow your shortlist with these resources:
- What Are the Best General Liability Insurance Providers?
- What Are the Cheapest General Liability Insurance Providers?
After reviewing these resources, use your industry category, state and employee count from this report to set expectations, then request quotes using consistent details. This gives you a clean baseline to identify whether you're being priced fairly.
If you want to learn about other business insurance costs
If you want to learn more about general liability coverage
If you want to explore other types of business insurance:
About Connor Bolton

Connor Bolton is Senior SEO and Content Manager at MoneyGeek, where he leads the business and pet insurance editorial teams. He sets the research framework, data standards and content structure for his team. All content goes through his accuracy review before publication. Connor also writes in-depth guides and has spent more than four years covering insurance products across personal, commercial and specialty lines.
The research infrastructure Connor built covers auto, home, renters, life, health, business and pet insurance across pricing analysis, carrier research, customer experience and coverage evaluation. It includes over 6 million data points for business insurance across 408 industry areas, all 50 states and 16 vehicle types. The pet insurance side covers over 5 million profiles across 18 major providers, 100+ breeds and ages up to 20 years. Connor’s insurance research and his team's work have been cited by the U.S. Chamber of Commerce, Allstate, Liberty Mutual, CBS News, Forbes and LegalZoom.
Connor also talks with underwriters and carrier liaisons at Ethos, The Hartford, ERGO NEXT, Nationwide and State Farm, and monitors business and pet owner communities on Reddit. Those sources shape how his team evaluates carriers, structures rate analysis and writes content for real pet owners.
Questions about MoneyGeek's business or pet insurance content? Reach him at connor@moneygeek.com or on LinkedIn.