
Jump to the section that fits your needs best:
Average Commercial Auto Insurance Cost (2026 Report)
Average commercial auto insurance costs range from $79 to $870 monthly and your rate will vary based on your vehicle type, industry and state.
If you want quotes now, we can match you to your best commercial auto insurer below.

Updated: September 9, 2026
Advertising & Editorial Disclosure
The Hartford
- Ethisphere named The Hartford a World's Most Ethical Company for the 17th time in 2026, one of only two honorees in property and casualty insurance.
- The Hartford ranks third overall for commercial auto in MoneyGeek's 2026 study and wins the Coverage Depth category.
- Cars, cargo vans, pickup trucks, box trucks and service utility trucks all fall under The Hartford's commercial auto coverage.
- Hired and non-owned auto liability from The Hartford covers employees who drive personal vehicles for work.
*MoneyGeek featured partner. Editorial rankings below are independent of this placement. Rates, rankings and savings comparisons are based on MoneyGeek's independent research and Hartford-reported data as of 2026. Figures are estimates and averages, not a guarantee of any individual quote, premium or discount.
How Much Does Commercial Auto Insurance Cost?
Commercial auto insurance costs $163 per month ($1,959 per year) for minimum coverage. This is a national benchmark derived from eight vehicle types across 25 general industry categories (including 400+ sub-industries) and all 50 states (including D.C.) to reflect the range of commercial fleet profiles.
However, your small business insurance rates will vary heavily depending on your vehicle's details, your drivers, and details surrounding your business's operations and location. This also does not represent commercial truck insurance costs, which we consider a completely separate category inclusive of larger cargo and livery vehicles like box trucks, semis, tankers and dump trucks.
To estimate average commercial auto insurance costs, MoneyGeek analyzed pricing estimates from five major commercial auto providers and modeled standardized premium estimates across common business vehicle profiles. These modeled results give a consistent national benchmark and show how premiums shift by vehicle type, industry and location.
Dataset Scope and Assumptions
Our cost modeling uses standardized inputs for comparable results across businesses.
- Providers analyzed: five major commercial auto providers
- Vehicle types covered: eight (Sedan, SUV, Pickup Truck, Van, Food Truck, Farm Tractor, Taxi, Limousine). Vehicles were only analyzed where they would realistically be used widely for commercial purposes within industry areas for accuracy.
- Industries covered: 25 general industry categories
- Location: all 50 states plus Washington, D.C.
- Coverage baseline: minimum coverage commercial auto policy (the market standard for benchmark comparisons)
How We Calculated Average Commercial Auto Insurance Costs
MoneyGeek's published averages represent modeled premiums for standardized business profiles, aggregated two ways. Each figure isolates one variable at a time so you can see where your costs land relative to the national benchmark of $163 per month.
- National Benchmark Average: The national average reflects the modeled premium for a minimum coverage policy across all vehicle types, industries and states in the dataset. This single figure covers all 51 states and territories, and gives you a starting reference point before accounting for your specific business profile.
- Segment Averages: To show how costs shift, MoneyGeek calculated average modeled premiums isolated by one variable at a time, covering vehicle type, general industry category and state. Segment averages aggregate modeled pricing trends across the full dataset so you can compare how premiums change across business types and regions. A sedan operator in Pennsylvania will see a very different number than a limousine service in Michigan.
Read our full methodology for more details.
When isolating vehicle type, rates range anywhere from $110/mo to up to $870/mo with the most commonly used vehicle types sitting somewhere around $110/mo to $230/mo. Primarily the highest rate differentials are from passenger carrying vehicles including taxis and limousines where prices are higher (over $700/mo on average) primarily due to liability risks, minimum requirements and frequency of driving are highest given the nature of their work.
$189$2,272-16%5$791$9,490-384%7Sedan$110$1,32632%1SUV$130$1,55621%2$186$2,228-14%4$870$10,439-433%8$230$2,759-41%6Farm Tractor$178$2,135-9%3Coverage level has the biggest impact on your commercial auto premium because it sets the maximum the insurer pays per occurrence. Minimum coverage averages $163 per month, which is the national benchmark used throughout this report. Mid-level coverage adds $71 per month above that baseline, and high coverage adds $190 per month.
Minimum
$163$1,959Medium
$234$2,803High
$353$4,240For most vehicles in our study, mid-level sits around 50/100/50 liability limits with collision and comprehensive and 100/300/100 liability limits with full coverage protection (collision and comprehensive) represents high coverage. Passenger vehicles like taxis and limos were assigned higher CSL limits ($500,000 for mid-level and $1 million for high-level) due to the high risk associated with their work. Minimum represents whatever is required by state and federal regulations based on vehicle type and industry area.
Industry classification is the third pricing factor for commercial auto insurance. Rates across 25 industries range from $89 per month for Marketing & Communications to $349 per month for Transportation & Logistics, a gap of $260 per month driven by how much driving each industry requires and what risk that driving carries.
Agriculture & Natural Resources$159$1,9073%14Arts, Media & Entertainment$128$1,53622%8Beauty, Body & Wellness Services$98$1,17140%3Childcare Services$146$1,74711%12$182$2,189-12%20$193$2,317-18%23$104$1,24436%5Education$124$1,48824%7Financial Services$94$1,12343%2Fitness Services$103$1,24037%4$181$2,175-11%19Healthcare & Medical$133$1,59818%10Hospitality, Travel & Tourism$192$2,298-17%22Manufacturing$189$2,266-16%21Marketing & Communications$89$1,06845%1Nonprofit & Associations$158$1,8973%13Other Professional Services$214$2,570-31%24Pet Care Services$143$1,71512%11Real Estate & Property Services$128$1,54021%9Recreation & Sports$159$1,9112%15Repair & Maintenance$176$2,115-8%17$164$1,969-1%16$123$1,47825%6Transportation & Logistics$349$4,188-114%25Wholesale & Distribution$177$2,126-9%18Below, is how the distribution breaks down:
- Lower-Cost Industries (20%+ Below National Average): Covers 36% of our general industries studied including Marketing & Communications, Financial Services, (Beauty, Body & Wellness Services), Fitness Services, Consulting Services, Tech/IT, Education, (Arts, Media & Entertainment), Real Estate & Property Services
- Mid-Cost Industries (Within 20% of National Average): Covers 56% of general industries studied including Healthcare & Medical, Pet Care Services, Childcare Services, Nonprofit & Associations, Agriculture & Natural Resources, Recreation & Sports, Retail & Product Rental, Repair & Maintenance, Wholesale & Distribution, Food & Beverage, Cleaning Services, Manufacturing, (Hospitality, Travel & Tourism), Construction & Contracting
- Higher-Cost Industries (More Than 20% Above National Average): Only 8% of our general industry categories including Other Professional Services (primarily due to funeral homes which is priced over $500/mo) and Transportation and Logistics.
Our main finding is how disproportionately most industries fall on the spectrum either lower or circling around the mean nationally (92% of all industry categories studied). Unsurprisingly, transportation as an industry is the most expensive by a long shot, sitting well over $100/mo higher than the next most expensive industry area. Though certain specialized sub-industries within categories of manufacturing like chemical, plastic and food makers/processors and those in warehousing (in wholesale category) sit over $600/mo.
State is the fourth pricing factor for commercial auto insurance because local regulations, medical costs, litigation activity and claim settlement patterns differ across markets. Monthly rates for minimum coverage range from $79 in Pennsylvania to $312 in Michigan for identical base coverage, a gap of $233 per month driven entirely by geography.
Alabama$135$1,61418%12Alaska$271$3,247-66%50Arizona$149$1,7839%20Arkansas$146$1,75011%18California$209$2,503-28%44Colorado$167$2,004-2%33Connecticut$193$2,321-18%40Delaware$133$1,59419%11Florida$230$2,763-41%49Georgia$156$1,8665%24Hawaii$86$1,02947%2Idaho$106$1,26635%5Illinois$179$2,153-10%36Indiana$157$1,8814%26Iowa$97$1,16940%4Kansas$142$1,70013%15Kentucky$155$1,8555%22Louisiana$179$2,153-10%35Maine$184$2,204-12%37Maryland$195$2,345-20%41Massachusetts$202$2,430-24%43Michigan$312$3,746-91%51Minnesota$161$1,9341%30Mississippi$155$1,8565%23Missouri$185$2,221-13%39Montana$131$1,57420%10Nebraska$135$1,62317%13Nevada$167$2,000-2%32New Hampshire$115$1,38129%6New Jersey$209$2,505-28%45New Mexico$130$1,56220%9New York$211$2,537-29%46North Carolina$164$1,9650%31North Dakota$128$1,53722%8Ohio$160$1,9252%29Oklahoma$145$1,74311%17Oregon$158$1,8933%27Pennsylvania$79$94752%1Rhode Island$201$2,408-23%42South Carolina$158$1,9013%28South Dakota$185$2,215-13%38Tennessee$145$1,73911%16Texas$220$2,644-35%47Utah$147$1,76310%19Vermont$92$1,09844%3Virginia$173$2,071-6%34Washington$157$1,8814%25Washington DC$224$2,694-37%48West Virginia$152$1,8197%21Wisconsin$119$1,42727%7Wyoming$140$1,68414%14States fall into three pricing tiers based on their difference from the national average:
- Lower-Cost States (20%+ Below National Average): Ten states fall into this tier (20%) including Pennsylvania, Hawaii, Vermont, Iowa, Idaho, New Hampshire, Wisconsin, North Dakota, New Mexico and Montana.
- Mid-Cost States (Within 20% of National Average): Thirty states/territories (59%) fall within 20% of the national average in either direction including Delaware, Alabama, Nebraska, Wyoming, Kansas, Tennessee, Oklahoma, Arkansas, Utah, Arizona, West Virginia, Kentucky, Mississippi, Georgia, Washington, Indiana, Oregon, South Carolina, Ohio, Minnesota, North Carolina, Nevada, Colorado, Virginia, Louisiana, Illinois, Maine, South Dakota, Missouri and Connecticut.
- Higher-Cost States (More Than 20% Above National Average): Eleven states and territories exceed the national average by a large margin (21%) including Maryland, Rhode Island, Massachusetts, California, New Jersey, New York, Texas , Washington, D.C., Florida, Alaska and Michigan.
This distribution is the most normalized with most states landing towards the middle of the spectrum. Pennsylvania, Vermont, Iowa and Hawaii stand out with rates 40% or further under national benchmarks. On the other end Florida, Alaska sit 40% or higher cost wise with Michigan by far sporting the largest rates (being 25% higher than the national average compared to the next most expensive state).
Get Commercial Auto Insurance Cost Estimates
For more tailored estimates, we provide commercial auto insurance calculator below to build costs around your profile.
What Factors Affect Commercial Auto Insurance Costs?
Commercial auto insurance pricing varies based on four core factors: coverage level, vehicle type, industry classification and geographic location. These variables explain most premium differences across small business fleets because they capture how insurers estimate claim frequency, severity and total exposure. Review MoneyGeek's commercial auto insurance cost data to see how each factor shifts your rate in dollar terms.
- Vehicle Type
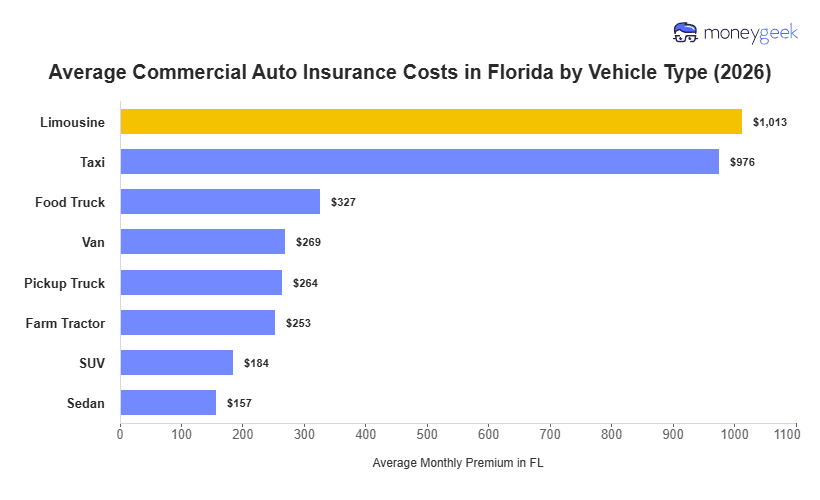
Vehicle type is the most influential pricing factor for commercial auto insurance because it determines an insurer's exposure to physical damage, bodily injury liability and the vehicle's replacement cost. It also often informs a business insurance provider of likelihood of accident based on likely use cases and driving statistics associated. According to our research, the differences are staggering with the low end of the spectrum for sedans being 32% below average while limousines sit 433% higher than national benchmarks.
- Industry Classification
Industry classification is the second most influential pricing factor for commercial auto insurance because it directly determines how much driving commercial vehicles do, what cargo they carry and the environments they operate in. Rates across 25 general industry categories range from 45% lower than average for marketing and communications businesses towards 114% higher for those in the transportation and logistics industry.
- Geographic Location
Geographic location is the has the third greatest effect on commercial auto insurance costs because state regulations, litigation patterns, medical costs and claim settlement practices vary considerably by market. The same vehicle doing the same work costs range from 52% lower on average in Pennsylvania and 91% higher in Michigan.
- Coverage Level
Coverage level is lowest strength core pricing driver for commercial auto insurance, and shifts rate directly by setting the actual investment an insurer is agreeing to if a covered event happens. Moving from minimum to high limits/broader coverage more than doubles the monthly premium.
How to Lower Commercial Auto Insurance Costs Without Sacrificing Coverage
Adjusting the inputs insurers use to price your policy is the most direct way to reduce commercial auto premiums without cutting coverage. Taking into account long-term methods also ensure you get the lowest price, even as your business grows.
Below, we'll guide you through all of the methods available to you, so you pay the lowest commercial auto insurance costs possible today and in the future.
Quick Commercial Auto Cost-Lowering Methods
We've ranked these immediate actions by lowest financial risk and highest effectiveness in order below.
- Provide accurate underwriting information from the start
Small differences in how your vehicles and business are described change your rating class and premium. Use accurate annual mileage estimates, the correct vehicle use code (commercial vs. business vs. pleasure) and clear descriptions of the work your drivers do. Insurers price your policy using worst-case assumptions when information is unclear or inconsistent.
- Compare quotes using identical coverage terms
A lower monthly quote means nothing if the policy carries a lower liability limit or excludes hired and non-owned auto coverage. Compare business insurance quotes across at least three providers using matching liability limits, deductibles and endorsements before choosing based on price.
- Bundle commercial auto with your general liability or BOP policy
Many insurers discount commercial auto when you combine it with a business owner's policy or general liability coverage. Ask for a bundled quote before comparing standalone commercial auto rates. Use our commercial auto insurance cost benchmarks to verify whether your bundled quote reflects a genuine discount against the $163 per month national average.
- Pay annually instead of monthly
Annual payments eliminate installment fees and often carry small discounts since the insurer receives the full premium upfront. This saves roughly 5% to 10% compared to monthly payment plans, though you'll need the full annual amount available at policy inception.
- Raise deductibles on physical damage coverage if your fleet has a clean history
Increasing comprehensive and collision deductibles from $500 to $1,000 reduces the physical damage portion of your premium by 15% to 25% on average. This works best for fleets with no claims in two or more years and enough cash reserves to cover the higher out-of-pocket cost after an incident.
Long-Term Commercial Auto Cost-Lowering Methods
Changing how insurers assess your fleet's risk at each annual renewal is where long-term cost reductions come from. These strategies take longer to produce results than immediate adjustments, but they generate compounding savings across multiple policy terms as your claims history and driver data improve.
Hard braking, speeding and nighttime driving all get monitored by telematics programs from major commercial auto insurers. Fleets with clean behavior data can reduce premiums by 10% to 15% at renewal. Review the program's data-sharing terms before enrolling, as participation requires sharing detailed driving behavior data with the insurer.
Recent claims history is what insurers use to re-evaluate your commercial auto policy at each renewal. Lower premiums, better underwriting terms and less nonrenewal risk all come from a clean loss run. The best ways to build a clean claims history:
- Reduce repeat incidents: Track patterns (same driver, same route, same vehicle type) and address root causes before they become claims.
- Document incidents early: Record near-misses and minor incidents before they escalate.
- Report claims promptly: Payout size and claims cycle time can shrink with fast reporting and complete documentation.
Measurable premium reductions from claims history improvements usually take one to three renewals to show up.
Claim frequency drops and rate penalties get avoided at renewal through driver safety controls. Clear hiring standards, motor vehicle record checks and documented safety training give insurers evidence that your business actively manages driver risk. High-impact controls to put in place:
- Written driver policies: Documented acceptable-use standards reduce liability after an accident.
- Regular MVR checks: Catch disqualifying violations before they become claims.
- Post-accident review: A documented response process reduces severity and shows insurers that you manage risk actively.
Commercial Auto Insurance Cost: Bottom Line
Insurers price your specific fleet risk, not a generic vehicle category, which is why commercial auto insurance costs vary widely. Coverage level, vehicle type, industry classification and state affect your premium most. The $163 a month figure is a market-wide starting point for minimum coverage, not a quote for your specific fleet.
Work through these three questions before evaluating quotes:
- Where do you fall compared to the national average? Consider vehicle type, industry and state together. A different cost baseline applies to a sedan-based marketing business in Pennsylvania than to a van-based cleaning service in Michigan.
- What's behind your cost? Separate baseline risk factors (vehicle type, industry, state) from coverage design choices (liability limits, deductibles, endorsements). Knowing which is which shows where you have room to adjust.
- What would change your price? Coverage level is the single largest controllable factor. Bundling, telematics enrollment and accurate underwriting details each produce measurable reductions when conditions are right.
Evaluate quotes against your actual fleet risk profile, not just the national average, by framing your premium this way.
If you want to learn about costs from other coverage types

About Mark Flores

Mark Flores is a Business Insurance Content Writer at MoneyGeek, where he focuses on commercial auto, commercial property, cyber and specialty business insurance coverage. His work simplifies coverage terms, gives business owners a strong baseline for expected costs, and narrows down policies and providers tailored to your operation, regardless of complexity.
Before joining MoneyGeekâs business insurance team, Mark worked as a Senior Content Writer at Clutch.co, where he produced structured B2B reviews and provider analyses based on client interviews, company research and service evaluation. That experience shaped his approach to business insurance content, especially when comparing insurers, explaining coverage differences and translating complex policy features into practical guidance for small business owners.
Mark also spent nearly 4 years as a digital marketing specialist serving small-business clients across industries such as home services, manufacturing and education. That background gives him practical context for how businesses evaluate vendors, manage operational needs and make purchasing decisions.
At MoneyGeek, he applies this research and evaluation experience to build guides that help transportation sectors, those with complex property-related risks (such as hotels and retail stores), and those most at risk of a cyberattack get the coverage they need at a reasonable price.
Linkedin: https://www.linkedin.com/in/mark-jason-flores-7844634a/
Contact Email: mark.flores@moneygeek.com