Average Cost of Having a Baby in the US

Advertising & Editorial Disclosure

Having a baby with employer-sponsored health insurance costs $20,416 in total medical spending, including $2,743 paid out of pocket for pregnancy, childbirth and postpartum care. Adding a child's medical care through age two brings total medical costs to $36,991, with $4,254 paid out of pocket.

The figures reflect medical and insurance costs for people with employer-sponsored coverage. New parents spend additional money on diapers, formula, clothing, furniture and other baby gear in the first year, which aren't captured in healthcare totals. Pregnancy and childbirth costs come on top of standard health insurance premiums families already pay.

mglogo icon
KEY FINDINGS
  • Pregnancy, childbirth and postpartum care cost $20,416 in total health spending and $2,743 out of pocket for people with employer-sponsored insurance, based on 2021 to 2023 claims data.
  • Out-of-pocket costs for vaginal delivery average $2,563, while C-sections average $3,071.
  • Children's medical costs in their first two years average $16,575, with $1,511 paid out of pocket for families with employer-sponsored insurance.
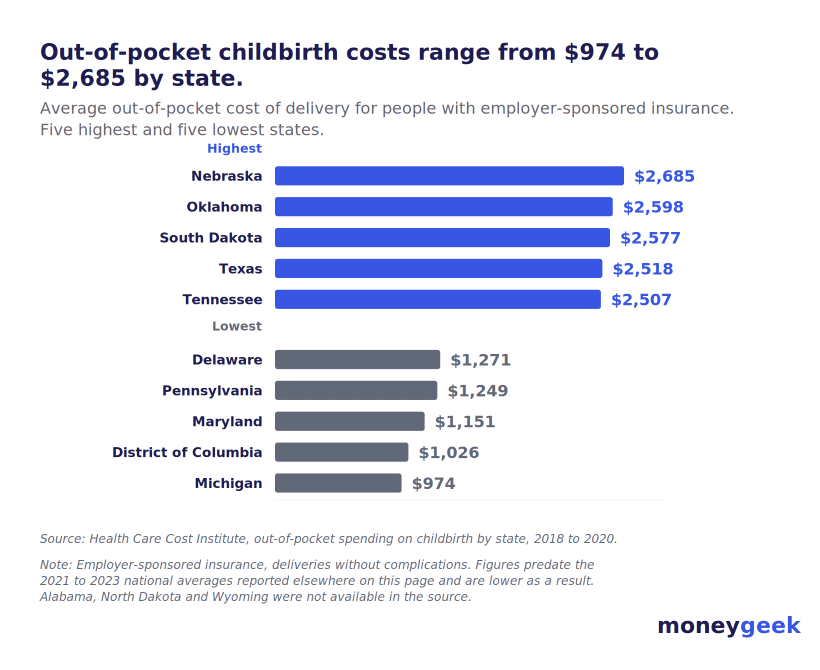
  • In 2020, out-of-pocket delivery costs ranged from $974 in Michigan to $2,685 in Nebraska for people with employer-sponsored insurance.
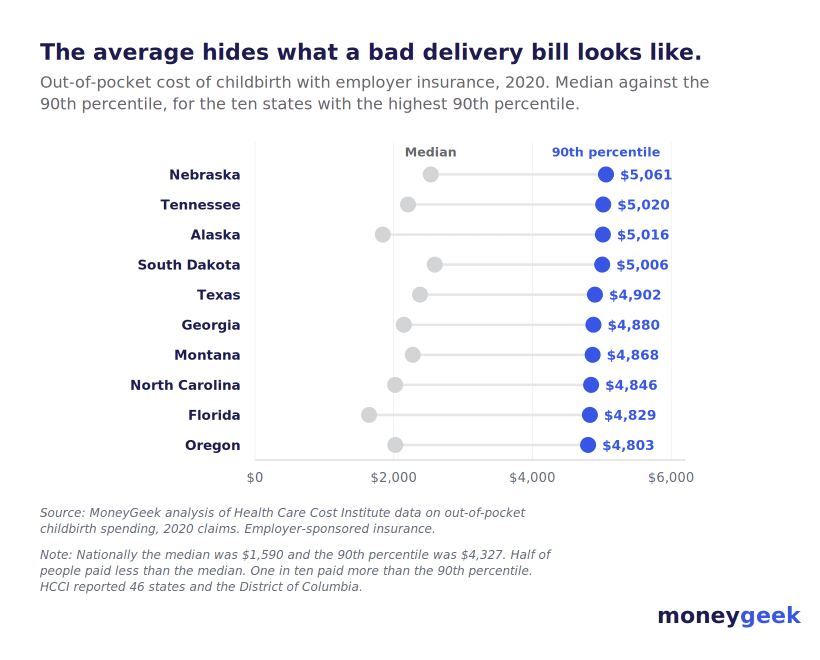
  • Half of insured families paid less than $1,590 out of pocket for a delivery in 2020, but one in ten paid more than $4,327.
  • Hospitals bill between 16% and 126% more for an uncomplicated cesarean than an uncomplicated vaginal birth, depending on the state.

Cost of Giving Birth With Insurance

The Centers for Disease Control and Prevention (CDC) reports 3,628,934 births in the U.S. in 2024, a 1% increase from 2023. Most births were vaginal, but 32.4% were Cesarean deliveries in 2024, up slightly from 32.3% in 2023.

Families with employer-sponsored insurance paid these average costs for pregnancy, childbirth and postpartum care, based on claims data from 2021 to 2023.

Average Cost of Giving Birth in the US

Vaginal delivery
$2,563
$15,712
C-section
$3,071
$28,998
Average overall
$2,743
$20,416

C-sections cost about $13,000 more in total health spending than vaginal deliveries and about $500 more out of pocket. Delivery costs include hospital charges and professional services from physicians, anesthesiologists and other clinicians during the hospital stay.

Why Out-of-Pocket Costs Can Feel Higher Than the Average

Many families pay more than the $2,743 national out-of-pocket average for prenatal care, delivery and postpartum visits combined. Final bills depend on plan design, including deductibles, coinsurance rates, out-of-pocket maximums and whether all services are in network.

The averages hide a wide spread. In 2020, the median out-of-pocket cost of a delivery was $1,590, meaning half of insured families paid less than that. The 90th percentile was $4,327, meaning one in ten paid more. In Nebraska the 90th percentile reached $5,061, and in 21 of the 46 jurisdictions with data it exceeded $4,500.

That range matters more than the average for anyone planning. An average describes a large group. A 90th percentile describes what a difficult delivery on a high-deductible plan can cost.

Childbirth cost spread - dot plot

Employer health benefits surveys show worker deductibles rising. Families pay a large amount out of pocket before coverage begins, and those with high-deductible plans or complicated pregnancies often pay far above average, especially when hospital stays run long or additional procedures come up.

Average Out-of-Pocket Cost of Giving Birth by State

Out-of-pocket costs span more than $1,700 across states, from $974 in Michigan to $2,685 in Nebraska. A 2020 analysis of employer-sponsored insurance claims found Great Plains and Southern states at the high end of that range, while Mid-Atlantic and Great Lakes states posted much lower average bills.

Choosing the right health plan before pregnancy can lower these costs.

Out-of-pocket cost of childbirth with employer insurance
nebraska icon
WHY NEBRASKA COSTS MORE THAN MICHIGAN

Nebraska families paid $2,685 out of pocket on average in 2020, 41% higher than the $1,905 national average. Michigan families paid $974, roughly half the national average.

Price differences explain the difference, not birth rates or C-section frequency. Nebraska's higher costs likely reflect higher negotiated prices in a less competitive hospital market. Michigan's unusually low costs point to a more competitive hospital market and lower average prices negotiated by employer plans.

Nebraska
$2,685
$2,718
$2,670
$2,535
$5,061
Oklahoma
$2,598
$2,722
$2,534
$2,462
$4,770
South Dakota
$2,577
$2,809
$2,501
$2,592
$5,006
Texas
$2,518
$2,636
$2,447
$2,379
$4,902
Tennessee
$2,507
$2,530
$2,494
$2,206
$5,020
Minnesota
$2,486
$2,579
$2,447
$2,396
$4,758
Alaska
$2,473
$2,692
$2,388
$1,843
$5,016
Idaho
$2,435
$2,596
$2,295
$2,192
$4,748
Montana
$2,420
$2,610
$2,305
$2,274
$4,868
Georgia
$2,330
$2,350
$2,319
$2,146
$4,880
North Carolina
$2,299
$2,491
$2,199
$2,021
$4,846
Arkansas
$2,284
$2,453
$2,194
$2,145
$3,963
Utah
$2,277
$2,346
$2,254
$2,000
$4,719
Oregon
$2,272
$2,319
$2,251
$2,023
$4,803
Maine
$2,264
$2,358
$2,220
$1,998
$4,756
Wisconsin
$2,250
$2,244
$2,252
$1,960
$4,753
West Virginia
$2,182
$2,307
$2,112
$1,897
$4,701
Colorado
$2,178
$2,318
$2,117
$1,991
$4,603
Washington
$2,153
$2,167
$2,147
$1,886
$4,284
Kentucky
$2,132
$2,194
$2,097
$1,932
$4,593
Nevada
$2,122
$2,219
$2,069
$1,894
$4,512
Louisiana
$2,112
$2,202
$2,058
$1,912
$4,366
Iowa
$2,060
$2,243
$1,975
$1,946
$4,140
Florida
$2,053
$2,037
$2,064
$1,644
$4,829
Ohio
$2,036
$2,025
$2,041
$1,795
$4,416
Kansas
$1,987
$2,015
$1,973
$1,824
$4,104
California
$1,955
$1,967
$1,949
$1,641
$4,508
Mississippi
$1,894
$1,989
$1,834
$1,610
$3,812
New Mexico
$1,863
$1,991
$1,817
$1,500
$3,897
Virginia
$1,842
$1,871
$1,826
$1,633
$3,975
Indiana
$1,839
$1,856
$1,831
$1,488
$4,249
Connecticut
$1,801
$1,744
$1,831
$1,491
$4,108
New Hampshire
$1,782
$1,806
$1,770
$1,500
$4,000
Missouri
$1,744
$1,808
$1,717
$1,465
$3,857
Arizona
$1,683
$1,805
$1,629
$1,183
$4,154
Rhode Island
$1,624
$1,581
$1,650
$1,021
$4,221
Illinois
$1,538
$1,589
$1,514
$1,234
$3,388
New Jersey
$1,447
$1,449
$1,446
$844
$3,946
Massachusetts
$1,431
$1,451
$1,421
$1,000
$3,396
New York
$1,416
$1,404
$1,423
$750
$3,849
South Carolina
$1,344
$1,331
$1,352
$754
$3,413
Delaware
$1,271
$1,365
$1,229
$490
$3,500
Pennsylvania
$1,249
$1,266
$1,241
$741
$3,371
Maryland
$1,151
$1,154
$1,149
$600
$3,129
District of Columbia
$1,026
$1,063
$1,008
$500
$2,743
Michigan
$974
$1,026
$949
$488
$2,745

*Note: State figures come from a 2020 analysis of out-of-pocket childbirth costs for people with employer-sponsored insurance. The analysis assumes no complications. Five jurisdictions are absent: Alabama, Hawaii, North Dakota, Vermont and Wyoming, each of which fell below the source's minimum provider and delivery-volume thresholds. More recent national averages from 2021 to 2023 show higher out-of-pocket costs of $2,563 for vaginal delivery and $3,071 for C-section, so current state averages are likely higher, even if relative rankings are similar.

Why Childbirth Costs Vary So Much by State

State-level childbirth cost differences come down mainly to price, not volume. For vaginal births, what hospitals charge and what insurers have negotiated drive most of the difference. Some hospitals and metro areas charge two to four times more than others for comparable deliveries.

For families on employer-sponsored plans, those price differences land directly in their bills. Coverage also varies by state for pregnancy-related benefits such as home visits, genetic screenings, dental care and diabetes monitoring supplies. Those differences affect total spending from prenatal care through postpartum recovery.

What Hospitals Bill Isn't What Anyone Pays

The out-of-pocket figures above describe what families with employer coverage paid. Hospitals bill something else entirely.

Across 38 states with 2023 hospital discharge data, the average facility charge for a delivery ranged from $12,343 in Maryland to $39,907 in New Jersey. Those are list prices, the amount a hospital bills before any insurer negotiates it down. They exclude physician and anesthesia fees.

Almost nobody pays a charge in full. Insurers negotiate them down, Medicaid pays a set rate well below them, and the out-of-pocket figures earlier on this page show what families with employer coverage were left with. A charge is an opening position, not a price.

That isn't a scandal on its own. It matters because the people most exposed to list prices are the uninsured and anyone whose birth happens out of network, and because the distance between a charge and a payment isn't the same in every state.

The Cesarean Markup Varies More Than the Surgery Does

A cesarean section is major abdominal surgery and a vaginal birth isn't, so a cesarean costs more everywhere. What varies is how much more.

Comparing deliveries with no complications on either side, the same severity tier for both procedures, hospitals bill between 16% and 126% more for a cesarean depending on the state. In Nebraska an uncomplicated cesarean is billed at $26,175 against $11,588 for an uncomplicated vaginal birth. In Maryland the same comparison is $12,545 against $10,789.

The comparison covers about 1.5 million deliveries. Restricting it to uncomplicated cases on both sides matters: it rules out the possibility that high-markup states are simply treating sicker patients. The spread barely moves when severity is held constant, which points at pricing rather than medicine.

Nothing here says hospitals perform cesareans they should not. The data describes what hospitals bill, not which deliveries happen or why. Those are separate questions and this analysis cannot speak to the second one.

What hospitals bill for a cesarean and a vaginal birth without complications.
maryland icon
THE MARYLAND DIFFERENCE

Maryland posts the lowest charges and by far the smallest cesarean markup in the data, and the reason is regulatory rather than medical.

Maryland has set hospital rates through an all-payer commission since 1971. Every payer is billed the same regulated rate, so no distance opens up between a list price and a negotiated one. Its charges sit close to what hospitals are paid.

That makes Maryland a useful reference point. The distance between Maryland and every other state is a rough measure of how much of a charge is a negotiating position rather than a price.

Nebraska
$11,588
$26,175
125.9%
Wyoming
$12,487
$26,170
109.6%
South Dakota
$12,619
$25,674
103.5%
New Mexico
$14,501
$28,606
97.3%
North Dakota
$9,739
$19,200
97.1%
Indiana
$19,466
$38,064
95.5%
Oregon
$16,296
$31,049
90.5%
Maine
$16,078
$30,580
90.2%
Washington
$20,221
$38,446
90.1%
Wisconsin
$14,446
$27,356
89.4%
North Carolina
$15,037
$28,381
88.7%
Iowa
$12,798
$23,898
86.7%
Illinois
$16,855
$31,309
85.8%
South Carolina
$18,822
$34,912
85.5%
Minnesota
$15,412
$28,484
84.8%
Arizona
$20,794
$38,121
83.3%
Kentucky
$15,085
$27,544
82.6%
West Virginia
$13,837
$24,784
79.1%
Kansas
$19,878
$35,546
78.8%
Hawaii
$14,602
$26,016
78.2%
Florida
$25,931
$46,068
77.7%
Montana
$12,458
$21,948
76.2%
Colorado
$22,478
$39,185
74.3%
Utah
$13,777
$24,008
74.3%
Delaware
$9,934
$17,013
71.3%
Mississippi
$18,947
$31,708
67.4%
Virginia
$15,550
$25,714
65.4%
Michigan
$14,499
$23,704
63.5%
Texas
$22,970
$36,930
60.8%
Missouri
$15,920
$25,025
57.2%
New York
$24,981
$38,293
53.3%
Tennessee
$18,873
$28,413
50.5%
Oklahoma
$15,516
$23,224
49.7%
Arkansas
$16,966
$25,023
47.5%
Rhode Island
$17,701
$26,116
47.5%
New Jersey
$32,391
$46,857
44.7%
Massachusetts
$17,427
$24,674
41.6%
Maryland
$10,789
$12,545
16.3%

*Note: Figures are what hospitals billed, not what insurers or families paid. They cover facility charges only and exclude fees from physicians, anesthesiologists and other clinicians. All figures are means, because the source publishes no median. Deliveries with recorded complications or comorbidities are excluded from both columns, which is what makes the two procedures comparable. Thirty-eight states reported 2023 discharge data in a form that supports this comparison. California isn't among them.

What This Means for Your Bill

If you have employer coverage, these charges are not what you will pay. Your cost depends on your deductible, your coinsurance and your out-of-pocket maximum, and the figures earlier on this page are the better guide.

Charges matter most if you are uninsured, if your hospital is out of network, or if a hospital bills you before insurance is applied. In those situations the list price is the starting point, and in most states it is several times the amount an insurer would have paid.

If you receive a bill built on charges, ask the hospital for its financial assistance policy and for the rate it accepts from insurers. Nonprofit hospitals are required to have a written assistance policy.

Hospitals billed these amounts in 2023 for deliveries with no recorded complications, the same severity tier on both sides of the comparison. States are ordered by how far apart the two procedures are:

Total First 2-Year Medical Costs With Insurance

Medical expenses extend well beyond delivery. For families with employer-sponsored insurance, pregnancy, childbirth and postpartum care average $20,416 in total health costs, of which families cover $2,743 themselves.

Children's medical care in the first two years adds another $16,575 in total health spending and $1,511 in out-of-pocket costs for families with employer-sponsored insurance. Pregnancy through a child's second birthday averages $36,991 in medical spending and $4,254 out of pocket for families with employer-sponsored insurance.

Average Medical Costs: Pregnancy Through Age 2 With Insurance

Pregnancy, childbirth and postpartum
$20,416
$2,743

Child healthcare (first 2 years)

$16,575
$1,511
Total medical costs
$36,991
$4,254

Add your newborn to your health insurance on time to start coverage from day one and avoid lapses in care or unexpected bills.

Understanding Out-of-Pocket Maximums

For 2025, individual out-of-pocket maximums for marketplace health plans are capped at $9,200 for in-network care. The cap rises to $10,600 in 2026. Even if your delivery becomes more complicated and expensive than expected, your in-network out-of-pocket costs on a marketplace plan won't exceed that limit.

Out-of-pocket maximums for employer-sponsored plans differ by design, but most non-grandfathered plans fall at or below federal limits tied to marketplace caps. Those limits put a ceiling on what families pay during high-risk or complicated pregnancies. Reaching that ceiling still means a large bill, and many new parents end up carrying medical debt.

Methodology

MoneyGeek uses out-of-pocket and total healthcare cost data from the Peterson-KFF Health System Tracker for pregnancy, childbirth, postpartum care and early childhood medical expenses. The analysis is based on 2021 to 2023 Merative/IBM MarketScan claims data for people with employer-sponsored insurance and their children up to age two.

State-level out-of-pocket data comes from the Health Care Cost Institute's May 2022 analysis of out-of-pocket childbirth spending, built on 2020 inpatient delivery claims for people with employer-sponsored insurance. That analysis covered 46 states and the District of Columbia. Alabama, Hawaii, North Dakota, Vermont and Wyoming fell below its minimum provider and delivery-volume thresholds.

Hospital charge figures come from the HCUP State Inpatient Databases for 2023, from the Agency for Healthcare Research and Quality, covering 2,326,828 delivery discharges across 38 states, excluding California.

Severity-matched figures compare DRG 807, vaginal delivery without sterilization or D&C and without complications or comorbidities, against DRG 788, cesarean section without sterilization and without complications or comorbidities.

All figures are means. HCUPnet publishes no median, so no median is available at any level of the charge analysis.

Charges are facility charges and exclude professional fees from physicians, anesthesiologists and other clinicians.

HCUPnet's DRG selection omits DRGs 783, 784, 796, 797 and 798, all of which involve sterilization procedures performed during the delivery admission. The omission is consistent across states, so comparisons hold, but absolute all-severity figures are affected. The uncomplicated comparison used for the headline figure is unaffected, because both DRGs it uses are available in every state.

No cross-source comparison is made between charges and payments. Published payment figures differ from this charge data in period, in whether professional fees are included, and in which payers are covered, so any ratio between them would be misleading.

The figures match other research on employer-sponsored maternity coverage and childbirth price variation. The analysis covers only families with employer-sponsored coverage and doesn't reflect costs for people on Medicaid, those using marketplace plans without employer contributions or people without insurance.

About Myryah Irby


Myryah Irby, Writer and Data Journalist

Myryah Irby is a writer and data journalist at MoneyGeek. Her work spans original data studies and how-to guides covering auto, home and health insurance, consumer costs and transportation safety.

Research and Analysis

Since joining MoneyGeek in late 2025, Irby has produced data studies on insurance costs, consumer spending and transportation risk. Her published work includes a 50-state analysis of winter driving danger using fatality and weather severity data; research tracking the relationship between rhodium commodity prices and catalytic converter theft rates, including state-level theft trends and what those rates mean for insurance costs; a state-by-state comparison of winter home heating costs; and an analysis of the full cost of having a baby in America: hospital bills, insurance and out-of-pocket expenses.

Career

Irby has more than 20 years of editorial and writing experience. Since 2005, she has run Irby x Irby, her own editorial and copywriting practice, with clients including The New York Times, The San Francisco Chronicle, OpenAI and the National Park Service. From 2019 to 2023, she served as Senior Managing Editor and then Copywriting Manager at Callisto Media, a nonfiction publisher acquired by Penguin Random House in May 2023, where she led a team of writers and graphic designers.

Before that, she spent nearly 11 years at QuinStreet, a performance marketing company that runs content and comparison sites in insurance and personal finance. She rose from Managing Editor to Senior Managing Editor between 2010 and 2016. Earlier in her career, she edited at Collabrys for nearly four years and tutored doctoral candidates on dissertation writing at the University of San Francisco.


Sources