


Car insurance costs $216 a month on average, but rates vary widely based on your age, driving record, credit score, location, vehicle type and coverage choices. Knowing how much car insurance you need and how to compare car insurance companies can help you get the best rate.
Average Cost of Car Insurance in 2026
Updated: May 28, 2026
Advertising & Editorial Disclosure
How Much Does Car Insurance Cost?: Key Takeaways
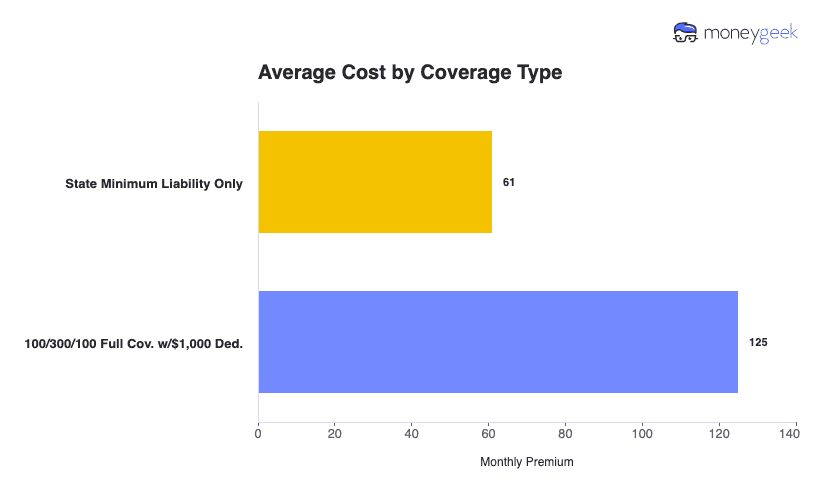
The average cost of full coverage car insurance is $2,575 a year ($216 a month), while minimum coverage costs $727 ($61 a month).
Car insurance costs continue rising due to increased repair costs and higher vehicle values. Car insurance rates have increased 11.3% in the last year and 57% since early 2022.
The gap between what you pay and what drivers with your profile pay is almost always explained by one of five variables. Your driver profile, location, credit score (in most states), insurance company choice and vehicle type affect your car insurance cost the most.
MoneyGeek analyzed 83,056 quotes from 46 companies across 473 ZIP codes, with rate data sourced from Quadrant Information Services and state insurance departments. The dataset covers urban centers, suburban markets and rural areas across every U.S. state to reflect real-world pricing variation rather than national averages.
The baseline profile is a 40-year-old man with a clean driving record, driving a 2012 Toyota Camry LE 12,000 miles a year, carrying 100/300/100 liability limits with a $1,000 comprehensive and collision deductible. Every section that shows rates for a specific profile, age, violation type, credit score or vehicle category substitutes that variable while keeping everything else constant. That approach isolates the cost impact of each factor so the numbers show you what that one change costs, not a different driver profile entirely.
Why You Can Trust MoneyGeek
MoneyGeek's average car insurance cost data is derived from analyzing 83,056 quotes from 46 companies across 473 ZIP codes, with rate information sourced from Quadrant Information Services and state insurance departments. We started with a baseline of a 40-year-old driver with a clean record, then adjusted age, gender, location, vehicle type, credit score and driving record to show how each factor affects your premium. That helps you spot where you're overpaying and what you can do about it.
*Full coverage refers to a policy with 100/300/100 liability limits, comprehensive and collision coverage with a $1,000 deductible. Minimum coverage represents the minimum required coverage mandated by each state and D.C., which varies by location.
How Much Is Car Insurance on Average?
| Full Coverage | $125 | $1,495 |
| Minimum Coverage | $61 | $727 |
Car Insurance Cost by Driver Profile
Driver profiles push car insurance costs from $120 to $537 a month for the same full coverage policy. That $417 gap means the national average of $216 describes almost no one's actual bill.
Clean record adult (25-54) | $215 | $100 |
Young driver (19-25) | $537 | $251 |
$270 | $135 | |
Driver with not-at-fault accident | $228 | $106 |
$310 | $145 | |
$377 | $177 | |
Driver with excellent credit | $120 | $57 |
$313 | $144 |
The two biggest jumps in that table are age and credit, each at 150% above the comparable baseline group. Those two variables create more rate variation than any violation short of a DUI. If either applies to your situation, the age and credit sections below identify the specific carriers and strategies most likely to lower your rate. See car insurance rates for married couples to find out how much coverage costs with multiple drivers on a policy.
Average Cost of Car Insurance by State
Location has the biggest effect on car insurance costs. Monthly premiums range from $75 in Vermont to $243 in Florida, a $168 difference for identical coverage. That $168-a-month difference has nothing to do with how well you drive. It comes down to state insurance rules, litigation environments, weather exposure and regional economics that vary across state lines.
Full coverage rates below use an ideal driver profile in each state. For more details, compare rates by state or see which companies rank as the cheapest and best overall.
Data filtered by:
Full Coverage
| Alabama | $104 | $1,245 |
| Alaska | $106 | $1,278 |
| Arizona | $136 | $1,628 |
| Arkansas | $114 | $1,373 |
| California | $155 | $1,861 |
| Colorado | $146 | $1,754 |
| Connecticut | $145 | $1,745 |
| Delaware | $179 | $2,149 |
| District of Columbia | $164 | $1,963 |
| Florida | $243 | $2,912 |
| Georgia | $135 | $1,620 |
| Hawaii | $82 | $983 |
| Idaho | $79 | $952 |
| Illinois | $99 | $1,189 |
| Indiana | $84 | $1,009 |
| Iowa | $97 | $1,162 |
| Kansas | $116 | $1,389 |
| Kentucky | $132 | $1,580 |
| Louisiana | $236 | $2,827 |
| Maine | $76 | $908 |
| Maryland | $150 | $1,802 |
| Massachusetts | $99 | $1,193 |
| Michigan | $138 | $1,652 |
| Minnesota | $109 | $1,310 |
| Mississippi | $123 | $1,472 |
| Missouri | $124 | $1,486 |
| Montana | $112 | $1,346 |
| Nebraska | $110 | $1,320 |
| Nevada | $152 | $1,826 |
| New Hampshire | $82 | $984 |
| New Jersey | $180 | $2,160 |
| New Mexico | $116 | $1,388 |
| New York | $120 | $1,435 |
| North Carolina | $105 | $1,264 |
| North Dakota | $90 | $1,078 |
| Ohio | $83 | $990 |
| Oklahoma | $133 | $1,599 |
| Oregon | $115 | $1,376 |
| Pennsylvania | $117 | $1,407 |
| Rhode Island | $126 | $1,518 |
| South Carolina | $130 | $1,559 |
| South Dakota | $106 | $1,269 |
| Tennessee | $103 | $1,233 |
| Texas | $150 | $1,799 |
| Utah | $127 | $1,524 |
| Vermont | $75 | $902 |
| Virginia | $97 | $1,162 |
| Washington | $109 | $1,305 |
| West Virginia | $111 | $1,326 |
| Wisconsin | $87 | $1,038 |
| Wyoming | $82 | $984 |
See How Much Car Insurance Will Cost You
Our car insurance calculator factors in your age, location, driving record and vehicle type to show what you'll pay, not just a national average.
Loading...
Average Car Insurance Cost by Company
Full coverage from major national insurers ranges from $97 a month (Travelers) to $161 (Allstate), a $64 difference that adds up to $768 a year. Read our company reviews for individual insurer details: State Farm, Progressive and Nationwide.
Data filtered by:
100/300/100 Full Cov. w/$1,000 Ded.
| Travelers | $97 | $-39 | -29% |
| State Farm | $121 | $-15 | -11% |
| Progressive | $125 | $-11 | -8% |
| Nationwide | $127 | $-9 | -6% |
| Farmers | $152 | $16 | 12% |
| Allstate | $161 | $26 | 19% |
The gap between Travelers and Allstate isn't a pricing error. Each runs a different business model with different pricing built in. Travelers and GEICO run direct-to-consumer operations with lower overhead and pass those savings on through lower premiums. Farmers and Allstate distribute through agent networks with higher operational costs built into every policy. Neither model is wrong, but knowing which one you're paying for helps explain why two carriers can quote such different numbers for the same driver.
Regional carriers not shown in this table frequently undercut national companies in the states where they operate. If your state table shows a regional carrier at the top, that rate is worth adding to your quote comparison before assuming one of these nationals is your cheapest option.
Average Car Insurance Cost by Age
Young drivers aged 19 to 25 pay $537 a month for full coverage, or 150% more than adult drivers who pay $215. Seniors pay $270 a month, about 26% more than middle-aged adults.
Data filtered by:
100/300/100 Full Cov. w/$1,000 Ded.
| Adult Drivers | $215 | $2,575 |
| Senior Drivers | $270 | $3,236 |
| Young Drivers | $537 | $6,442 |
Young drivers aged 16 to 19 have crash rates nearly four times higher per mile driven than drivers 20 and older. They're more likely to speed, drive distracted and make risky decisions due to inexperience and incomplete brain development. That higher risk costs real money. Teenage coverage can add $322 a month to a family policy. For affordable coverage for young drivers, see our guide to the cheapest car insurance for new drivers.
Senior drivers see rate increases after age 70 due to age-related changes including slower reaction times, vision changes and medication effects that increase accident risk. Learn more about when car insurance rates go down as you age and the average cost of car insurance for 16-year-olds.
Your age is one of the biggest factors in what you pay. See a full breakdown of car insurance rates by age to find where your age group falls compared to the national average.
Age and location compound these rate differences further. Our cost by age and state breakdown covers how rates shift for identical driver profiles across states.
Average Cost of Car Insurance by Credit Score
Credit score drives one of the largest rate gaps in car insurance. Monthly premiums range from $120 for drivers with excellent credit to $313 for those with poor credit. That $193-a-month difference equals $2,316 in extra premiums a year for identical coverage. If you're concerned about credit checks, see our list of insurance companies that don't check credit scores.
Data filtered by:
100/300/100 Full Cov. w/$1,000 Ded.
| Below Fair | $236 | $2,836 |
| Excellent | $120 | $1,442 |
| Fair | $187 | $2,247 |
| Good | $125 | $1,495 |
| None | $215 | $2,575 |
| Poor | $313 | $3,752 |
Insurers use credit scores for two reasons. Drivers with lower credit scores file more claims on average, and they're more likely to miss payments or let a policy lapse. Both factors raise the carrier's risk, which gets priced into the premium. That's not a personal judgment; it's how insurers price the risk of a future claim or missed payment.
California, Hawaii, Massachusetts and Michigan don't allow insurers to use credit scores when setting rates. If you live in one of those four states, your credit history has no effect on what you pay. The table above excludes pricing in those markets.
Average Car Insurance Costs by Vehicle Type
Annual premiums range from $1,291 for minivans to $3,006 for luxury sports cars. Vehicle type affects costs because repair expenses, replacement values and theft rates differ across vehicle categories. For truck owners, see our guide to the best car insurance for pickup trucks.
Average annual car insurance cost by vehicle type
Annual full coverage premium — ranked cheapest to most expensive
Source: MoneyGeek rate analysis. Full coverage, 40-year-old driver, clean record.
| Minivan | $1,291 |
| Compact SUV | $1,378 |
| SUV | $1,387 |
| Pickup Truck | $1,429 |
| Compact | $1,436 |
| Sedan | $1,479 |
| Electric | $1,514 |
| Luxury Compact SUV | $1,561 |
| Sports Car | $1,713 |
| Luxury Compact | $1,745 |
| Luxury SUV | $1,792 |
| Luxury Sedan | $1,967 |
| Luxury Electric | $2,722 |
| Luxury Sports Car | $3,006 |
Where your vehicle lands in this table comes down to three things: what it costs to repair, how often that model gets stolen and how it performs in crash tests. If you drive a luxury or electric vehicle, expect to pay more on all three counts. If you're shopping for a new car and insurance cost matters, a compact SUV or pickup usually costs the least to insure for what you get.
New vehicles cost more to insure than used ones. Check rates by make and model before you buy.
Car Insurance Rate Trends: Why Costs Are High and How They've Changed (2020 to 2025)
Average car insurance rates have risen 51% since late 2019. Modern vehicles cost more to repair because of advanced technology. A replacement bumper with sensors runs about $3,000 versus $500 for an older car. Repair costs have climbed more than 10% a year since 2022, up from 3% to 5% pre-pandemic.
Medical costs for injury claims have also risen, and extreme weather is compounding the pressure. The U.S. logged over $92 billion in climate-related damages in 2023, though rate growth has since slowed. Car insurance inflation dropped from a peak of 23% in April 2024 to 5.3%, and 2025 rate increases came in at 7.5%, down from 16.5% in 2024.
Factor | Impact |
|---|---|
Post-pandemic recovery issues | Supply chains are still recovering from COVID-19 disruptions. That's driven up costs for car parts and repairs. Demand surged after lockdowns ended while manufacturing struggled to keep pace. |
Rising inflation | General inflation raises costs across all sectors, including insurance. As goods and services cost more, insurers raise premiums to cover their operating costs. |
Higher repair costs | Modern vehicles have advanced technology that makes parts more expensive to repair or replace. Repair costs climbed more than 10% a year since 2022, up from 3% to 5% pre-pandemic. The average repair reached around $4,721 by 2023. |
Supply chain delays | Scarce parts drive up repair costs. Those higher costs get passed on through insurance rates. |
Rising vehicle values | Higher car prices raise the financial risk on total-loss claims, and insurers raise rates to offset that exposure. |
Increasing medical expenses | Medical costs for injury claims have grown steadily. Insurers pass those increases on through higher premiums. |
Impact of climate change | More frequent and intense weather events, including hurricanes, wildfires and floods, have driven up insurer losses. The U.S. reported more than $92 billion in climate-related damages in 2023. |
Life changes | Major life changes can shift your premium unexpectedly. See how insurance costs change after divorce and what to do to avoid overpaying. |
Dozens of variables shape your premium. See the complete list of factors that affect car insurance rates and which ones you can control.
Car Insurance Cost: FAQ
The average annual cost of car insurance for U.S. drivers is $727 for minimum coverage and $2,575 for full coverage. Both figures shift based on location, driving history and vehicle type. Young drivers pay $6,442 a year; clean-record adults pay $2,575.
Young drivers aged 19 to 25 pay the most for car insurance at $537 a month, followed by drivers with DUIs at $377, drivers with poor credit at $313 and those with at-fault accidents at $310 a month. Clean-record adults with good credit pay the least at $120 to $215 a month, depending on age.
Yes, car insurance costs more for expensive cars. Luxury sports cars cost $3,006 a year to insure versus $1,291 for minivans. Expensive vehicles cost more to repair or replace, carry higher total-loss payouts and get targeted for theft more often. Check out our guide to the cheapest car insurance for sports cars for more affordable options.
Four factors drive the biggest rate differences: location (Vermont $75 a month vs. Florida $243 a month), driving record (clean $215 a month vs. DUI $377 a month), credit score (excellent $120 a month vs. poor $313 a month) and age (adults $215 a month vs. young drivers $537 a month). Your vehicle type, coverage choices and deductible amounts add to the variation.
Compare quotes from at least three insurers, as rates vary by $50 to $100 a month for identical coverage. Increase your deductible from $500 to $1,000 to save 10% to 15% on comprehensive and collision coverage. Use all applicable discounts. Bundle your auto and home insurance for discounts of 15% to 25%. Keep a clean driving record, improve your credit score and ask about good driver, good student and low-mileage discounts. For more savings tips, see our guide to finding cheap full coverage car insurance.
Most traffic violations affect your car insurance rates for three to five years. Minor violations like speeding tickets impact rates for three years in most states. Major violations like DUIs affect rates for five to 10 years. The exact window depends on your state. The rate increase hits hardest right after the violation and drops gradually until it falls off your record.
How different violations affect monthly full coverage costs:
- Speeding 11 to 15 mph over: $268 (+$53)
- At-fault accident: $310 (+$95)
- DUI: $377 (+$162)
Coverage requirements vary by state. Higher mandates raise your baseline premium regardless of your driving history or location. States that require broader coverage, like PIP or uninsured motorist protection, set higher minimum premiums than those requiring only basic liability. Michigan's first-party benefits system is among the most expansive in the country and creates some of the nation's highest rates, while states with lower liability limits allow cheaper minimum coverage policies. Learn more about what liability car insurance coverage includes in your state.
Claim frequency, weather patterns and vehicle theft rates push premiums up in affected states. Urban density, medical costs and litigation environments add further to regional rate differences.
About Mark Fitzpatrick

Mark Fitzpatrick, a licensed Property and Casualty (P&C) Insurance Producer in Connecticut, is MoneyGeek's resident insurance expert. He has spent nearly a decade analyzing the market, first at LendingTree and now at MoneyGeek, where he produces original research on hundreds of carriers and millions of rates across auto, home, renters, health and life insurance.
He covers economics and insurance at MoneyGeek, and his work has been featured in The Washington Post, The New York Times and NPR, among other outlets.
Like all MoneyGeek analysts, he draws on independent cost and consumer experience data. No insurance company partnership influences his recommendations.
Mark holds a B.A. from Boston College and an M.A. in Economics and International Relations from Johns Hopkins University. He started his career in financial risk management at State Street and is also a five-time “Jeopardy!” champion.
Sources
- Insurance Information Institute. "Senior Driving Safety and Insurance Tips." Accessed May 28, 2026.
- National Safety Council. "Age of Driver." Accessed May 28, 2026.