



Jump to the section that meets your needs best below:
Average Pest Control Insurance Cost (2026 Report)
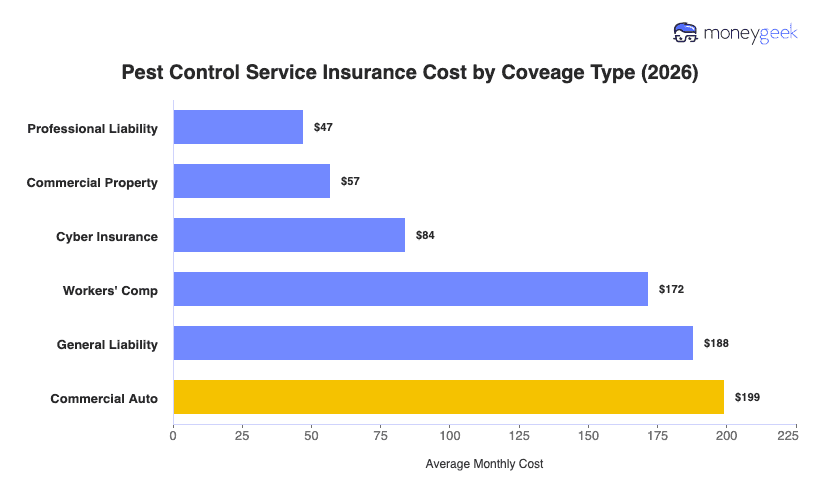
Pest control business insurance costs $47 to $199 per month, based on crew size, application methods, service mix and whether you operate vehicles.
If you're ready to get a quote, use the tool below to get matched with the best business insurance provider for your pest control operations.
Select state
Updated: September 11, 2026
Advertising & Editorial Disclosure
How Much Does Pest Control Insurance Cost?
Your pest control business insurance averages $124 per month, or $1,493 per year, across the six most common coverage types. To get the estimated cost of contractor business insurance for pest control, MoneyGeek analyzed quotes for businesses with one to four employees across 50 states and Washington, D.C., with standard policy limits of $1 million per occurrence and $2 million aggregate, and 16 vehicle types for commercial auto.
Depending on the coverage type, your individual policy costs range from $47 to $199 per month. Professional liability is cheapest because your service guarantees and treatment certifications create some exposure, but a missed treatment or a recurring infestation rarely produces the kind of claim that makes premiums much higher. At the other end, commercial auto prices highest because your service vehicles are operational necessities loaded with chemical equipment, driven to every job site your technicians work.
Treat these figures as benchmarks rather than quotes since your actual premiums vary based on payroll, claims history, location and coverage mix.
| Professional Liability | $47 | $561 | 17% | 78 |
| Commercial Property | $57 | $681 | 55% | 197 |
| Cyber Insurance | $84 | $1,007 | -1% | 239 |
| Workers' Comp | $172 | $2,061 | -52% | 321 |
| General Liability | $188 | $2,255 | 53% | 331 |
| Commercial Auto | $199 | $2,389 | -22% | 316 |
We analyzed quote data from major U.S. commercial insurance providers and modeled standardized premium estimates across business profiles representing around 95% of the market. Results are designed to provide a consistent national benchmark showing how premiums vary by key baseline factors including business size, restaurant profession type, location and vehicle type for operations that use commercial vehicles.
Dataset Scope and Assumptions
Our cost modeling uses standardized inputs for consistent comparisons across businesses.
- Total estimates modeled: just over 6 million standardized pricing estimates
- Providers analyzed: 10 major insurance providers
- Geography: all U.S. states including Washington, D.C.
- Employee count bands: solo practitioners, one to four, five to nine, 10 to 19, and 20 to 49 employees
- Vehicle types studied: Sedans, SUVs, pickup trucks, vans, taxis, limousines, tractors, food trucks, semi-trucks (non-HAZMAT and HAZMAT), tanker trucks (non-HAZMAT and HAZMAT), buses, box trucks, dump trucks, flatbed trucks
- Policies studied: general liability, workers' comp, professional liability, commercial auto, commercial property, and cyber insurance
- General liability: $1 million per occurrence and $2 million aggregate
- Workers' comp: state required coverage
- Professional liability: $1 million per claim and $1 million aggregate
- Commercial auto: minimum coverage
- Commercial property: personal property coverage limits personalized to industry, business size and state
- Cyber insurance: $1 million per occurrence and $1 million aggregate
How We Calculated Average Pest Control Service Business Insurance Costs
Our published averages represent modeled premiums for standardized business profiles and were aggregated in two ways.
- National benchmark average: The national average cost reflects the modeled premium for a standardized one to four employee business across all and states included in our dataset for a standard policies
- Segment averages: To show how costs vary, we calculated average modeled premiums for our national base profile and isolated for variables, including:
- Employee count (business size ranges)
- Vehicle types (for commercial auto)
- States (including Washington, D.C.)
Segment averages were produced by aggregating modeled pricing trends across the full dataset so readers can compare how premiums shift across coverage types and regions.
See our full business insurance methodology.
Get Pest Control Business Insurance Cost Estimates
Use our pest control business insurance cost calculator below for more personalized estimates and to compare rates.
Get Pest Control Insurance Cost Estimates
Select Coverage Type
Select State
Select Employee Count
Select Vehicle Type
Monthly Rate Estimate—
Select Coverage Type
Monthly Rate Estimate—
Select State
Select Employee Count
Select Vehicle Type
Factors Affecting Pest Control Insurance Costs
The cost of pest control business insurance depends on more than business size or location. MoneyGeek's analysis found that operational factors such as the chemicals handled, how technicians work and what service agreements promise carry more weight in pest control pricing than in most contractor categories.
 Chemical and Pesticide Handling
The pesticide classes used in the operation send a direct signal to insurers about liability exposure. The more restricted or hazardous the chemicals technicians apply, the greater the exposure in the event of a misapplication, environmental contamination or third-party injury claim.
 Service Vehicle Use
Every vehicle technician drives to a job site is a rated unit on the commercial auto policy and a liability exposure on the general liability policy. When the business runs multiple routes with chemical equipment on board, the compounding exposure is meaningfully higher than a solo operator's.
 Type of Pest Control Work
Fumigation, termite treatment and rodent exclusion each carry different risk profiles. When the business performs structural tent fumigation, the work involves restricted-use pesticides, temporary occupant displacement and a higher severity potential when something goes wrong. Insurers price that exposure accordingly.
 Service Guarantees and Warranties
When the business offers treatment warranties or re-service guarantees, it creates a documented standard of performance that can be used to establish liability in a claim. Formal warranties add a measurable professional liability exposure that businesses without them do not carry.
 Licensing and Certification Level
Pest control is one of the more heavily licensed contractor categories. When technicians apply or supervise the use of restricted-use pesticides, federal EPA requirements mandate certification under a state program that meets federal standards. That certification raises the assumed standard of care, which affects how insurers assess the overall risk profile.
How to Lower Pest Control Insurance Costs
Your pest control operation has more room to move on insurance costs than most contractor categories, but the levers aren't all immediate. Our analysis shows that the operational factors driving your premium, from chemical use and service type to vehicle exposure, are also the ones most responsive to targeted adjustments across both timelines. These five methods reflect what's most actionable for your operation, two of which build toward affordable business insurance over time.
 Compare quotes using the same coverage limits
Your pest control coverage mix, including general liability, commercial auto and professional liability, varies enough by provider that quotes built on different limits aren't comparable. When you compare quotes, make sure they reflect identical limits and deductibles across all three, because the cheaper one may not be the better one.
 Right-Size Your Coverage
If you run a solo operation treating residential properties for common pests, your exposure profile looks very different from a fumigation contractor working commercial structures. If your coverage was quoted for a broader service scope than you actually operate, you may be paying for exposure your business doesn't carry. Review your policy limits and covered services against your actual work mix before each renewal.
 Bundle policies with the same provider
If your operation runs general liability, workers' comp and commercial auto simultaneously, placing all three with a single carrier typically unlocks a multi-policy discount and keeps your renewal dates aligned, reducing the chance of a gap between policies.
 Lower your risk profile
Your risk classification is built around the chemicals you apply, the services you offer and the vehicles you operate. Moving away from restricted-use pesticides, subcontracting higher-severity fumigation work or reducing your fleet size are changes that take time to register with insurers but can shift your classification and your renewal rate over multiple policy periods.
- Lower your risk profile
The claims that hit your renewal pricing hardest, such as chemical misapplication, technician injuries, vehicle incidents, are also the ones most preventable through consistent operational discipline. Building that discipline into your daily workflow takes time to register with insurers, but it's what moves the needle on your long-term rate.
- Require technicians to complete annual applicator safety training that covers handling, storage and emergency response for every pesticide class your business uses.
- Document every treatment with application records that include the chemical used, concentration, target pest and technician name. Keeping these on file limits your liability exposure when a service claim is disputed.
- Run a pre-route vehicle inspection checklist for any truck carrying chemical equipment. Consistent checks reduce your accident frequency and support a clean commercial auto claims record over time.
- Set a formal re-inspection schedule for your termite and rodent exclusion jobs within 30 days of treatment. Catching issues early keeps callbacks from escalating into warranty claims that affect your renewal pricing.
Pest Control Insurance Cost: Bottom Line
The $124 per month average provides a reference point, but it reflects a specific profile. The actual rate shifts based on trade type, the states of operation and the scope of services the business provides. It should be treated as a diagnostic, not a prediction.
When requesting quotes, these questions help put the figures in context:
- Where does the operation fall in the distribution? The position relative to the benchmarks by coverage type and state should be located first. A two-person termite inspection operation in one state sits in a very different part of the distribution from a multi-route fumigation contractor working across several markets.
- Is the quote consistent with the risk profile? A quote that sits well above or below the benchmarks for the trade and location is worth examining before accepting or rejecting it. That gap may reflect claims history, pesticide classification or a coverage structure that does not match how the operation actually runs.
- Which cost drivers apply to your business? Not every factor carries equal weight for every pest control operation. Chemical handling matters more if you work with restricted-use pesticides, as vehicle exposure becomes a priority if you run multiple routes daily. Identify which drivers actually apply to your profile before drawing conclusions from the averages.
The distance between an industry benchmark and your actual quote usually comes down to a small number of operation-specific variables. Understanding which ones apply to your business and why they move your rate in a particular direction makes these benchmarks genuinely useful.
About Connor Bolton

Connor Bolton is Senior SEO and Content Manager at MoneyGeek, where he leads the business and pet insurance editorial teams. He sets the research framework, data standards and content structure for his team. All content goes through his accuracy review before publication. Connor also writes in-depth guides and has spent more than four years covering insurance products across personal, commercial and specialty lines.
The research infrastructure Connor built covers auto, home, renters, life, health, business and pet insurance across pricing analysis, carrier research, customer experience and coverage evaluation. It includes over 6 million data points for business insurance across 408 industry areas, all 50 states and 16 vehicle types. The pet insurance side covers over 5 million profiles across 18 major providers, 100+ breeds and ages up to 20 years. Connor’s insurance research and his team's work have been cited by the U.S. Chamber of Commerce, Allstate, Liberty Mutual, CBS News, Forbes and LegalZoom.
Connor also talks with underwriters and carrier liaisons at Ethos, The Hartford, ERGO NEXT, Nationwide and State Farm, and monitors business and pet owner communities on Reddit. Those sources shape how his team evaluates carriers, structures rate analysis and writes content for real pet owners.
Questions about MoneyGeek's business or pet insurance content? Reach him at connor@moneygeek.com or on LinkedIn.
Sources
- U.S. Environmental Protection Agency. "How to Get Certified as a Pesticide Applicator." Accessed September 17, 2026.