


Jump to the section that meets your needs best below:
Average Bounce House Insurance Cost (2026 Report)
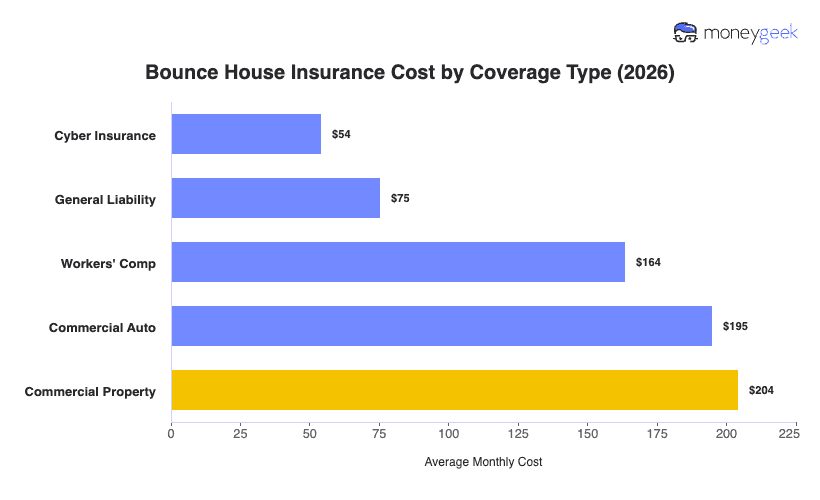
Bounce house insurance costs $54 to $204 per month, based on fleet size, crew headcount, event types served and whether you operate company vehicles.
If you're ready to get a quote, use the tool below to get matched with the best business insurance provider for your bounce house.
Select state
Updated: September 11, 2026
Advertising & Editorial Disclosure
How Much Does Bounce House Business Insurance Cost?
The cost of retail business insurance for bounce house rentals averages $138 per month or $1,662 per year, across five coverage types. That figure reflects businesses with one to four employees, standard policy limits of $1 million per occurrence and $2 million aggregate, and operations across all 50 states and Washington, D.C.
Within the retail and product rental category, bounce house operations rank 25th out of 35 on affordability, which means most retail segments price lower. At the individual policy level, the range runs $54 to $204 per month. Cyber insurance sits at the low end at $54, reflecting the relatively narrow online exposure most operators carry, like booking software and payment processing. Commercial property reaches $204, driven by the replacement cost of owned inflatable inventory: a single commercial-grade unit runs $3,000 to $8,000, and most operators carry several.
Use the table below as a benchmark for your planning as your actual premium will vary based on your business profile.
| Cyber Insurance | $54 | $649 | 35% | 48 |
| General Liability | $75 | $904 | -39% | 170 |
| Workers' Comp | $164 | $1,964 | -45% | 311 |
| Commercial Auto | $195 | $2,339 | -19% | 294 |
| Commercial Property | $204 | $2,453 | -64% | 316 |
We analyzed quote data from major U.S. commercial insurance providers and modeled standardized premium estimates across business profiles representing around 95% of the market. Results are designed to provide a consistent national benchmark showing how premiums vary by key baseline factors including business size, restaurant profession type, location and vehicle type for operations that use commercial vehicles.
Dataset Scope and Assumptions
Our cost modeling uses standardized inputs for consistent comparisons across businesses.
- Total estimates modeled: just over 6 million standardized pricing estimates
- Providers analyzed: 10 major insurance providers
- Geography: all U.S. states including Washington, D.C.
- Employee count bands: solo practitioners, one to four, five to nine, 10 to 19, and 20 to 49 employees
- Vehicle types studied: Sedans, SUVs, pickup trucks, vans, taxis, limousines, tractors, food trucks, semi-trucks (non-HAZMAT and HAZMAT), tanker trucks (non-HAZMAT and HAZMAT), buses, box trucks, dump trucks, flatbed trucks
- Policies studied: general liability, workers' comp, professional liability, commercial auto, commercial property, and cyber insurance
- General liability: $1 million per occurrence and $2 million aggregate
- Workers' comp: state required coverage
- Professional liability: $1 million per claim and $1 million aggregate
- Commercial auto: minimum coverage
- Commercial property: personal property coverage limits personalized to industry, business size and state
- Cyber insurance: $1 million per occurrence and $1 million aggregate
How We Calculated Average Bounce House Service Business Insurance Costs
Our published averages represent modeled premiums for standardized business profiles and were aggregated in two ways.
- National benchmark average: The national average cost reflects the modeled premium for a standardized one to four employee business across all and states included in our dataset for a standard policies
- Segment averages: To show how costs vary, we calculated average modeled premiums for our national base profile and isolated for variables, including:
- Employee count (business size ranges)
- Vehicle types (for commercial auto)
- States (including Washington, D.C.)
Segment averages were produced by aggregating modeled pricing trends across the full dataset so readers can compare how premiums shift across coverage types and regions.
See our full business insurance methodology.
Get Bounce House Business Insurance Cost Estimates
Use our bounce house business insurance calculator below for more personalized estimates and to compare rates.
Get Bounce House Insurance Cost Estimates
Select Coverage Type
Select State
Select Employee Count
Select Vehicle Type
Monthly Rate Estimate—
Select Coverage Type
Monthly Rate Estimate—
Select State
Select Employee Count
Select Vehicle Type
Factors Affecting Bounce House Business Insurance Costs
Several operational realities specific to bounce house rentals drive meaningful cost variation in bounce house business insurance. In our analysis, the factors that move your premiums most aren't general business characteristics. They're tied directly to how your operation is structured: how many units you run, who uses them and how your crew gets them there.
 Inflatable unit count and value
The more units you own, the more replacement exposure your insurer is pricing. The more units you own, the more replacement exposure your insurer is pricing. Commercial-grade inflatables carry significant per-unit asset value, and the larger your fleet, the more that total weighs on your policy at underwriting.
 Event type and venue
If your bookings skew toward festivals, school carnivals or corporate events, your insurer sees a different risk profile than a calendar of private backyard rentals. Public and high-attendance events bring more guests, less controlled environments and higher potential severity if an injury occurs, and your premiums reflect that mix.
- Primary user demographic
The injury record for bounce houses skews young, and insurers price your account accordingly. A peer-reviewed study using CPSC data estimated roughly 160,000 emergency department visits among children ages 2 to 18 over 20 years, with kids under 7 making up nearly half of that total.
 Delivery radius and road exposure
Every rental requires a truck or trailer run, and the farther your crew travels, the more road exposure your policy absorbs. If your operation covers multiple counties or crosses state lines, expect your premiums to run higher than operators working a tight local radius.
 Setup surface and site conditions
The CPSC's inflatable amusement safety bulletin identifies improper anchoring as an immediate danger to occupants. If your operation regularly sets up on concrete, asphalt or uneven terrain rather than grass, insurers see a higher anchoring risk in your account and your premiums reflect it.
How to Lower Bounce House Business Insurance Costs
Reducing the cost of affordable business insurance for your bounce house operation takes more than shopping around. In our analysis, the most effective way to move your premiums combines immediate policy-level adjustments with longer-term risk management. In an industry where child injury exposure and equipment value already shape what you pay, both timelines matter.
 Compare quotes using the same coverage limits
Your operational profile shapes your quotes more than most operators expect. Fleet size, delivery radius and crew headcount all vary significantly in this industry, so getting quotes on identical coverage limits and the same operational inputs lets you evaluate price differences between carriers rather than coverage differences. That comparison gives you a cleaner read on where your premium actually stands in the market.
 Right-Size Your Coverage
If your operation runs seasonally, which is from spring through fall in most markets, your coverage needs during off-peak months may look different from peak season. Review whether your policy reflects your actual operating window, your crew size during slower periods and the number of units actively in rotation. Coverage calibrated to your peak season year-round is a common source of unnecessary premium for smaller operators.
 Increase your deductible strategically
A higher deductible lowers your premium in exchange for more out-of-pocket exposure when a claim occurs. If you're carrying commercial property and commercial auto coverage, this lever can produce meaningful savings, provided your cash reserves can absorb the deductible without disrupting your operations after a loss.
 Bundle policies with the same provider
If your operation carries general liability, commercial auto and commercial property coverage, placing all three with one carrier typically qualifies your account for a multi-policy discount and simplifies your renewal process. One underwriter reviews your full operational profile rather than three separate ones pricing your risks in isolation.
 Invest in risk management practices
Documented safety protocols do more than protect your customers. Over time, they signal lower claims risk to underwriters and can work in your favor at renewal. Practices worth building into your operation include:
- Inspecting your setup surface at every event site and documenting anchoring conditions before inflation
- Training your crew on CPSC and ASTM F2374 anchoring standards for both grass and hard-surface setups
- Keeping a signed safety checklist for each rental that records unit condition, setup surface, weather conditions and occupancy limits
- Running a weight and age screening protocol at public and high-attendance events where supervising younger children is harder to maintain
Bounce House Business Insurance Cost: Bottom Line
Bounce house rental businesses pay an average of $138 per month for business insurance, though your actual premium will land somewhere in that range, shaped by a small number of variables specific to how your operation runs.
Three questions help you interpret where your quote is likely to fall relative to that benchmark:
- Where do you fall in the distribution? Start by locating your operation relative to the benchmarks using your fleet size, crew headcount and delivery radius. A small owner-operator running a handful of units locally will sit differently in the range than a crew-based operation serving festivals across multiple counties.
- Is your quote consistent with your risk profile? If your quote sits significantly above or below the benchmarks for your operation type, that gap is worth understanding before you accept or reject it. The mix of coverage types you're carrying and how your operation is described to the underwriter both affect where your quote lands.
- Which cost drivers apply to your business? Not every factor carries equal weight for every bounce house operator. Surface conditions and event type mix matter more for a business serving public festivals than for one focused on private residential bookings, so identify the factors most relevant to how you actually operate.
Your quote reflects how underwriters answer those same questions about your specific operation. Knowing which inputs carry the most weight gives you a clearer read on your quote and a sounder basis for comparing what different carriers are pricing.
About Connor Bolton

Connor Bolton is Senior SEO and Content Manager at MoneyGeek, where he leads the business and pet insurance editorial teams. He sets the research framework, data standards and content structure for his team. All content goes through his accuracy review before publication. Connor also writes in-depth guides and has spent more than four years covering insurance products across personal, commercial and specialty lines.
The research infrastructure Connor built covers auto, home, renters, life, health, business and pet insurance across pricing analysis, carrier research, customer experience and coverage evaluation. It includes over 6 million data points for business insurance across 408 industry areas, all 50 states and 16 vehicle types. The pet insurance side covers over 5 million profiles across 18 major providers, 100+ breeds and ages up to 20 years. Connor’s insurance research and his team's work have been cited by the U.S. Chamber of Commerce, Allstate, Liberty Mutual, CBS News, Forbes and LegalZoom.
Connor also talks with underwriters and carrier liaisons at Ethos, The Hartford, ERGO NEXT, Nationwide and State Farm, and monitors business and pet owner communities on Reddit. Those sources shape how his team evaluates carriers, structures rate analysis and writes content for real pet owners.
Questions about MoneyGeek's business or pet insurance content? Reach him at connor@moneygeek.com or on LinkedIn.
Sources
- Journal of Pediatric Surgery. "Distribution of Injury in Inflatable Jumping Amusements in the U.S. Over the Last 20 Years." Accessed September 25, 2026.
- U.S. Consumer Product Safety Commission. "Amusement Ride Safety Bulletin: Inflatable Amusement Devices — Residential and Commercial Guidance." Accessed September 25, 2026.