Where Mechanics Are Stretched Thinnest: Cars per Mechanic by State and Metro

Updated: November 5, 2026

Advertising & Editorial Disclosure

Oregon has 469 household vehicles for every automotive service technician. New Hampshire has 223. An Oregon mechanic has more than twice as many cars in line as a mechanic in New Hampshire.

Repair bills are rising at the same time. Bureau of Labor Statistics price data show vehicle maintenance and repair costs rose 5.8% nationally in the 12 months through September 2026. Car insurance prices fell 5.0% over the same stretch.

BLS projects about 66,200 openings for technicians a year through 2035. About 4,100 of those are new jobs; the rest replace technicians who retire or leave the trade.

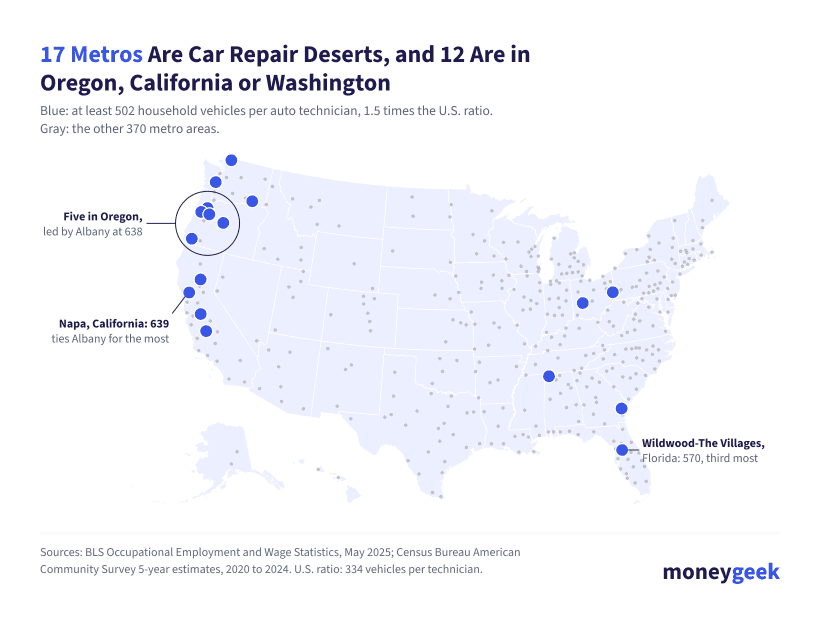
MoneyGeek ranked all 50 states and 387 metro areas on how many household vehicles each technician serves, using BLS employment estimates and Census Bureau vehicle counts. The study also ranks states on vehicles per body repairer and per repair shop with paid employees. Seventeen metros, most of them in Oregon, California and Washington, have at least 1.5 times the national ratio. MoneyGeek calls those repair deserts.

None of this measures how long a repair takes. It measures how many cars are in line for each mechanic, and that’s worth knowing before a collision coverage claim leaves a driver paying for a rental.

mglogo icon
STUDY FINDINGS
  • Oregon has the most cars per mechanic. Oregon has 469 household vehicles per automotive service technician, compared with 334 nationally. Washington (464) and Alabama (435) follow.
  • Three states rank among the 10 least served on every measure. Washington, Delaware and Alabama are in the bottom 10 for technicians, body repairers and repair shops with paid staff. Rhode Island is the only state in the top 10 on all three.
  • Technicians earn more in the least-served states. The 10 states with the most vehicles per technician have a median technician wage of $55,810, compared with $48,735 in the 10 best-served states.
  • Seventeen metros are repair deserts. Each has at least 502 household vehicles per technician, 1.5 times the national ratio. Napa, California (639), and Albany, Oregon (638), lead. Twelve of the 17 are in Oregon, California or Washington, and none has a million or more residents.
  • San Diego leads the large metros. San Diego has 468 vehicles per technician, the most among 56 metros with a million or more residents. Five of the 10 least-served large metros are in California; Salt Lake City has the fewest at 236.
  • Repair prices rose while premiums fell. Repair prices are up 56% since January 2020 and insurance prices are up 48%. Over the past year, repair prices rose 5.8% while insurance prices fell 5.0%.
State tile map showing cars per mechanic

Best and Worst Served States by Measure

No single state ranks last on all three measures. The spread between the best- and worst-served state runs from 2.1 times for technicians to 2.8 times for body repairers. Among metros, it reaches 3.7 times.

Household vehicles per technician
Oregon (469)
New Hampshire (223)
2.1x
Household vehicles per body repairer
Wyoming (2,656)
Rhode Island (944)
2.8x
Household vehicles per employer repair shop
Tennessee (2,474)
Vermont (1,072)
2.3x
Metro: household vehicles per technician
Napa, CA (639)
Carson City, NV (173)
3.7x

Household Vehicles per Mechanic in All 50 States

Oregon ranks first for technicians, Wyoming for body repairers and Tennessee for employer repair shops. In each column, rank 1 is the state with the most household vehicles per worker or shop, the least served, and the U.S. ratio for technicians is 334.

Oregon
469
1
1,973
10
1,806
23
$58,520
Washington
464
2
2,576
2
2,101
8
$57,270
Alabama
435
3
2,174
4
2,266
4
$45,640
California
404
4
1,881
15
1,681
30
$64,980
Ohio
391
5
1,488
33
2,029
11
$48,710
Delaware
388
6
2,182
3
2,125
7
$58,410
Colorado
381
7
1,500
31
1,686
29
$61,280
South Dakota
380
8
955
49
1,133
49
$51,160
Kansas
377
9
1,539
28
1,766
27
$47,790
Wisconsin
373
10
1,703
20
1,645
32
$54,350
Connecticut
368
11
1,383
42
1,810
22
$60,220
Virginia
367
12
1,764
19
1,915
20
$59,330
Minnesota
366
13
1,506
30
1,602
35
$58,390
Massachusetts
359
14
1,493
32
1,455
38
$60,760
Louisiana
357
15
1,855
17
1,985
14
$46,400
Alaska
354
16
1,860
16
1,626
33
$60,840
Georgia
352
17
1,661
21
2,064
9
$49,060
Nebraska
350
18
1,424
40
1,335
43
$50,560
Hawaii
345
19
2,075
6
2,358
2
$52,160
Tennessee
344
20
1,406
41
2,474
1
$50,290
Iowa
343
21
1,427
39
1,520
37
$50,510
Wyoming
341
22
2,656
1
1,373
41
$51,330
Montana
339
23
1,965
11
1,303
44
$58,740
Oklahoma
338
24
1,288
45
1,927
18
$46,560
New Jersey
336
25
1,592
25
1,563
36
$56,610
Michigan
329
26
1,464
36
1,728
28
$54,120
Arizona
328
27
1,956
12
1,959
16
$49,570
New Mexico
320
28
2,006
8
2,024
12
$47,300
Maine
319
29
1,589
26
1,286
45
$52,040
North Carolina
316
30
1,616
23
1,974
15
$48,200
Indiana
314
31
1,369
43
1,769
26
$49,360
Idaho
313
32
1,851
18
1,672
31
$48,420
Arkansas
312
33
1,998
9
2,058
10
$44,160
North Dakota
311
34
978
48
1,271
46
$57,360
Kentucky
308
35
2,044
7
2,282
3
$44,890
Pennsylvania
307
36
1,356
44
1,375
40
$49,800
Florida
303
37
1,638
22
1,788
25
$48,260
Maryland
301
38
1,461
37
1,792
24
$57,520
New York
301
38
1,129
46
1,213
47
$54,120
South Carolina
301
38
1,884
14
2,211
5
$48,100
Vermont
300
41
1,507
29
1,072
50
$51,630
Rhode Island
299
42
944
50
1,339
42
$51,770
Mississippi
298
43
1,600
24
2,174
6
$37,820
Nevada
298
43
2,170
5
1,926
19
$48,290
Texas
297
45
1,471
35
1,992
13
$48,310
West Virginia
292
46
1,954
13
1,943
17
$37,660
Illinois
287
47
1,473
34
1,412
39
$49,170
Missouri
273
48
1,078
47
1,615
34
$49,160
Utah
265
49
1,558
27
1,831
21
$46,570
New Hampshire
223
50
1,438
38
1,166
48
$59,020

Oregon’s 469 comes from 6,990 technicians for 3,275,807 household vehicles. Washington is close behind at 464 and also ranks second for body repairers, at 2,576 vehicles each. Alabama is the most consistent of the low-ranked states: third for technicians, fourth for body repairers and fourth for employer shops.

The three measures often disagree. Wyoming leads on body repairers at 2,656 vehicles each but ranks 22nd for technicians. Its lead rests on a BLS estimate of 200 body repairers statewide; 20 more would move Wyoming to second, behind Washington. Tennessee, at 2,474 vehicles per employer shop, ranks 20th for technicians. South Dakota is eighth for technicians yet 49th for body repairers.

At the well-served end, New Hampshire has 223 vehicles per technician, followed by Utah (265), Missouri (273), Illinois (287) and West Virginia (292). Rhode Island has the fewest vehicles per body repairer (944) and ranks among the 10 best-served states for technicians and employer shops as well.

The West Has the Most Cars per Mechanic

The West has 379 household vehicles per technician, the highest of the four Census regions. The Northeast has the lowest at 316, with the South (320) and Midwest (332) between them. Four of the 10 least-served states for technicians are in the West, four are in the Midwest (Ohio, South Dakota, Kansas and Wisconsin) and two are in the South (Alabama and Delaware). None is in the Northeast.

The pattern reverses for repair shops. The South has 1,998 household vehicles per employer repair shop, more than any other region, and the Northeast has 1,370.

Pay doesn’t explain the technician map, at least not simply. The 10 least-served states have a median technician wage of $55,810, against $48,735 in the 10 best-served states. Those wages aren’t adjusted for living costs, and this data can’t say whether higher pay is drawing technicians in or failing to keep up with demand.

What the Repair Shop Counts Show

Census counts 135,268 auto repair shops with paid employees in the 50 states and 401,505 repair businesses with no paid employees, about three for every employer shop. These one-person businesses are mostly self-employed owners, and the Census category also includes oil change shops and car washes. Each is counted as a business, whatever its size. The count doesn’t capture service bays or the hours an owner works, and MoneyGeek ranks states on employer shops instead.

Adding them would change the ranking. One-person businesses make up 85% of Florida’s repair businesses, the highest share of any state, and counting them would make Florida the best-served state for shops. On employer shops alone, Florida ranks 25th. Florida’s lead comes from one-person businesses.

Oregon Has the Most Metro Repair Deserts

MoneyGeek defines a repair desert as a metro area with at least 1.5 times the national ratio of household vehicles per technician, or 502 or more. Seventeen of 387 metros meet that bar. Napa, California, has 639 vehicles per technician and Albany, Oregon, has 638, a tie within the margin of error of BLS estimates. Wildwood-The Villages, Florida (570), Corvallis, Oregon (567), and Grants Pass, Oregon (566), follow.

Oregon has five repair deserts, California has four and Washington has three. All 17 have fewer than 1 million residents. Carson City, Nevada, has the fewest vehicles per technician of any metro, at 173.

Map showing 12 of the 17 metro repair deserts are in Oregon, California or Washington
1
Napa, CA
639
160
$76,450
Small
Yes
2
Albany, OR
638
170
$53,290
Small
Yes
3
Wildwood-The Villages, FL
570
180
$47,480
Small
Yes
4
Corvallis, OR
567
130
$54,330
Small
Yes
5
Grants Pass, OR
566
140
$54,330
Small
Yes
6
Olympia-Lacey-Tumwater, WA
540
450
$51,260
Medium
Yes
7
Merced, CA
538
330
$59,390
Medium
Yes
8
Salem, OR
535
590
$57,960
Medium
Yes
9
Florence-Muscle Shoals, AL
534
240
$39,800
Small
Yes
10
Springfield, OH
528
200
$46,300
Small
Yes
10
Walla Walla, WA
528
90
$50,090
Small
Yes
12
Bellingham, WA
525
360
$56,550
Small
Yes
13
Hinesville, GA
520
110
$46,810
Small
Yes
14
Hanford-Corcoran, CA
519
170
$64,090
Small
Yes
15
Weirton-Steubenville, WV-OH
512
170
$40,670
Small
Yes
16
Bend, OR
509
440
$57,300
Medium
Yes
17
Chico, CA
507
320
$63,070
Small
Yes
18
Auburn-Opelika, AL
498
300
$47,250
Small
No
19
Amherst Town-Northampton, MA
494
220
$58,980
Small
No
20
Bremerton-Silverdale-Port Orchard, WA
491
470
$53,820
Medium
No
21
Gadsden, AL
484
170
$42,200
Small
No
22
Eugene-Springfield, OR
481
620
$51,770
Medium
No
23
Jackson, MI
478
240
$51,870
Small
No
24
Ann Arbor, MI
477
540
$58,420
Medium
No
25
Staunton-Stuarts Draft, VA
471
230
$49,470
Small
No
25
Yakima, WA
471
410
$50,150
Medium
No
27
Monroe, MI
468
270
$57,400
Small
No
27
San Diego-Chula Vista-Carlsbad, CA
468
4,910
$64,320
Large
No
29
Yuba City, CA
467
280
$58,580
Small
No
30
Greeley, CO
466
600
$60,920
Medium
No
30
Sierra Vista-Douglas, AZ
466
220
$44,540
Small
No
32
Pueblo, CO
462
290
$58,480
Small
No
33
Decatur, AL
460
290
$45,740
Small
No
34
Prescott Valley-Prescott, AZ
457
490
$47,480
Medium
No
35
Salinas, CA
455
620
$62,770
Medium
No
36
Bakersfield-Delano, CA
450
1,250
$62,450
Medium
No
36
Barnstable Town, MA
450
430
$60,650
Small
No
36
Santa Cruz-Watsonville, CA
450
450
$58,860
Medium
No
39
Portland-Vancouver-Hillsboro, OR-WA
447
4,180
$60,450
Large
No
40
Vallejo, CA
446
760
$69,710
Medium
No
41
San Luis Obispo-Paso Robles, CA
445
520
$61,620
Medium
No
42
Bridgeport-Stamford-Danbury, CT
444
1,460
$62,440
Medium
No
43
Wenatchee-East Wenatchee, WA
442
230
$50,940
Small
No
44
San Jose-Sunnyvale-Santa Clara, CA
439
3,040
$77,840
Large
No
45
Anniston-Oxford, AL
438
200
$44,590
Small
No
46
Huntsville, AL
437
940
$46,840
Medium
No
47
Medford, OR
436
420
$57,390
Small
No
48
Visalia, CA
435
700
$46,280
Medium
No
49
Dalton, GA
433
250
$47,770
Small
No
50
Spokane-Spokane Valley, WA
432
1,100
$54,840
Medium
No
51
Seattle-Tacoma-Bellevue, WA
430
6,860
$59,290
Large
No
52
Montgomery, AL
427
670
$47,030
Medium
No
52
Santa Maria-Santa Barbara, CA
427
700
$61,110
Medium
No
54
Racine-Mount Pleasant, WI
426
350
$50,320
Small
No
55
Dover, DE
424
320
$48,800
Small
No
56
Niles, MI
423
270
$49,450
Small
No
57
Kenosha, WI
421
310
$57,540
Small
No
58
Atlantic City-Hammonton, NJ
420
630
$54,840
Medium
No
58
Homosassa Springs, FL
420
300
$46,150
Small
No
60
Durham-Chapel Hill, NC
419
1,090
$51,580
Medium
No
61
Daphne-Fairhope-Foley, AL
417
470
$45,720
Medium
No
61
Mount Vernon-Anacortes, WA
417
280
$55,270
Small
No
61
Oxnard-Thousand Oaks-Ventura, CA
417
1,450
$65,160
Medium
No
64
Riverside-San Bernardino-Ontario, CA
415
7,680
$64,210
Large
No
65
San Francisco-Oakland-Fremont, CA
412
7,270
$76,030
Large
No
66
Birmingham, AL
411
2,220
$47,830
Large
No
66
Cleveland, TN
411
260
$48,900
Small
No
68
Madison, WI
410
1,270
$60,650
Medium
No
68
Manhattan, KS
410
240
$44,410
Small
No
68
Slidell-Mandeville-Covington, LA
410
490
$47,350
Medium
No
71
Bay City, MI
408
200
$47,830
Small
No
72
Green Bay, WI
406
640
$56,180
Medium
No
73
Charlottesville, VA
405
430
$59,130
Small
No
74
Stockton-Lodi, CA
404
1,310
$62,840
Medium
No
74
Sumter, SC
404
190
$46,500
Small
No
76
Columbus, OH
401
3,920
$56,150
Large
No
77
Gettysburg, PA
399
220
$48,770
Small
No
78
Longview-Kelso, WA
398
230
$54,080
Small
No
79
Dayton-Kettering-Beavercreek, OH
397
1,570
$47,100
Medium
No
79
Fort Collins-Loveland, CO
397
790
$61,610
Medium
No
79
Johnson City, TN
397
450
$49,830
Small
No
82
Kennewick-Richland, WA
396
590
$53,450
Medium
No
83
Las Cruces, NM
393
420
$45,690
Small
No
83
Traverse City, MI
393
320
$52,220
Small
No
85
Kingsport-Bristol, TN-VA
392
670
$48,670
Medium
No
86
Fresno, CA
390
1,890
$52,000
Large
No
86
Lexington Park, MD
390
440
$56,560
Small
No
88
Rocky Mount, NC
389
300
$38,880
Small
No
88
Warner Robins, GA
389
390
$49,120
Small
No
90
Athens-Clarke County, GA
388
440
$51,170
Small
No
90
Helena, MT
388
220
$57,820
Small
No
90
Morristown, TN
388
260
$47,600
Small
No
90
Santa Rosa-Petaluma, CA
388
1,000
$75,080
Medium
No
94
Lansing-East Lansing, MI
385
890
$56,130
Medium
No
94
Youngstown-Warren, OH
385
840
$46,090
Medium
No
96
Tuscaloosa, AL
383
530
$45,070
Medium
No
97
Boulder, CO
382
670
$63,950
Medium
No
97
Colorado Springs, CO
382
1,600
$60,710
Medium
No
97
New Orleans-Metairie, LA
382
1,610
$49,190
Medium
No
100
Dothan, AL
381
300
$44,170
Small
No
100
Eagle Pass, TX
381
90
$44,360
Small
No
100
Hartford-West Hartford-East Hartford, CT
381
2,160
$58,910
Large
No
100
Lawrence, KS
381
240
$47,880
Small
No
104
Cincinnati, OH-KY-IN
379
4,520
$49,090
Large
No
104
Cleveland, OH
379
4,120
$50,260
Large
No
104
Minneapolis-St. Paul-Bloomington, MN-WI
379
7,180
$60,490
Large
No
107
Burlington, NC
378
370
$45,750
Small
No
107
Los Angeles-Long Beach-Anaheim, CA
378
22,330
$62,820
Large
No
109
Eau Claire, WI
377
370
$50,280
Small
No
109
Wichita, KS
377
1,330
$47,800
Medium
No
111
Redding, CA
375
380
$50,260
Small
No
111
Topeka, KS
375
510
$48,320
Small
No
113
Virginia Beach-Chesapeake-Norfolk, VA-NC
374
3,560
$58,290
Large
No
114
Ames, IA
373
260
$58,820
Small
No
114
Lake Havasu City-Kingman, AZ
373
540
$46,670
Small
No
116
Rochester, MN
372
480
$49,920
Small
No
117
Goldsboro, NC
371
260
$43,970
Small
No
117
Oshkosh-Neenah, WI
371
360
$52,040
Small
No
119
Monroe, LA
370
400
$43,760
Small
No
119
Pittsfield, MA
370
250
$51,400
Small
No
119
Rapid City, SD
370
360
$58,980
Small
No
122
Lynchburg, VA
368
590
$46,970
Medium
No
122
Santa Fe, NM
368
370
$55,640
Small
No
124
Flagstaff, AZ
367
300
$49,030
Small
No
124
Modesto, CA
367
1,030
$62,770
Medium
No
124
Sebring, FL
367
210
$44,650
Small
No
127
Denver-Aurora-Centennial, CO
366
6,340
$61,960
Large
No
127
Grand Forks, ND-MN
366
220
$58,680
Small
No
127
Muskegon-Norton Shores, MI
366
340
$47,350
Small
No
130
Bloomington, IN
364
330
$48,480
Small
No
131
Canton-Massillon, OH
362
860
$46,990
Medium
No
132
Iowa City, IA
361
360
$49,960
Small
No
132
Tucson, AZ
361
2,150
$48,600
Large
No
134
York-Hanover, PA
360
1,000
$55,110
Medium
No
135
La Crosse-Onalaska, WI-MN
359
370
$50,180
Small
No
135
Mansfield, OH
359
250
$48,350
Small
No
137
Columbus, GA-AL
358
630
$48,830
Medium
No
137
Urban Honolulu, HI
358
1,720
$49,020
Medium
No
139
Atlanta-Sandy Springs-Roswell, GA
357
12,310
$51,450
Large
No
139
Richmond, VA
357
2,930
$61,510
Large
No
141
Cheyenne, WY
356
250
$53,750
Small
No
141
Pocatello, ID
356
200
$46,450
Small
No
141
Sacramento-Roseville-Folsom, CA
356
4,870
$72,020
Large
No
144
Columbus, IN
355
190
$49,180
Small
No
144
Houma-Bayou Cane-Thibodaux, LA
355
400
$45,840
Small
No
144
Lebanon, PA
355
300
$49,180
Small
No
147
Pinehurst-Southern Pines, NC
354
250
$48,640
Small
No
148
Augusta-Richmond County, GA-SC
353
1,260
$48,730
Medium
No
148
Ithaca, NY
353
190
$48,820
Small
No
150
Midland, MI
352
190
$48,490
Small
No
151
Enid, OK
351
130
$40,670
Small
No
152
Duluth, MN-WI
350
650
$52,640
Medium
No
152
Worcester, MA
350
1,720
$54,330
Medium
No
154
Winston-Salem, NC
349
1,630
$46,080
Medium
No
155
Brunswick-St. Simons, GA
348
250
$47,880
Small
No
155
Gainesville, GA
348
440
$55,330
Small
No
157
Reading, PA
347
890
$51,310
Medium
No
158
Allentown-Bethlehem-Easton, PA-NJ
346
1,830
$57,810
Medium
No
158
Lafayette-West Lafayette, IN
346
480
$49,290
Small
No
158
Roanoke, VA
346
740
$51,230
Medium
No
161
Chattanooga, TN-GA
345
1,320
$51,020
Medium
No
161
Lafayette, LA
345
810
$45,920
Medium
No
161
Milwaukee-Waukesha, WI
345
3,170
$62,530
Large
No
161
South Bend-Mishawaka, IN-MI
345
670
$49,080
Medium
No
165
Cedar Rapids, IA
344
650
$49,890
Medium
No
165
Sandusky, OH
344
280
$46,660
Small
No
167
Lincoln, NE
343
770
$49,500
Medium
No
167
Washington-Arlington-Alexandria, DC-VA-MD-WV
343
12,030
$61,860
Large
No
169
Anchorage, AK
342
850
$59,880
Medium
No
169
Austin-Round Rock-San Marcos, TX
342
5,210
$50,610
Large
No
169
Baton Rouge, LA
342
1,710
$48,480
Medium
No
169
Hagerstown-Martinsburg, MD-WV
342
690
$47,800
Medium
No
169
Kalamazoo-Portage, MI
342
560
$48,210
Medium
No
169
Michigan City-La Porte, IN
342
250
$50,400
Small
No
169
Valdosta, GA
342
310
$46,730
Small
No
176
Champaign-Urbana, IL
341
460
$48,090
Small
No
176
Great Falls, MT
341
210
$59,110
Small
No
176
Springfield, MA
341
870
$56,440
Medium
No
179
Mobile, AL
340
890
$47,330
Medium
No
179
Sioux Falls, SD-MN
340
720
$59,190
Medium
No
181
Bozeman, MT
339
330
$61,320
Small
No
181
Greenville, NC
339
390
$47,220
Small
No
181
Sioux City, IA-NE-SD
339
330
$54,230
Small
No
184
Hammond, LA
338
280
$45,450
Small
No
184
Rome, GA
338
210
$47,460
Small
No
186
Jacksonville, NC
337
430
$46,180
Small
No
186
Knoxville, TN
337
2,280
$48,540
Medium
No
186
Waterbury-Shelton, CT
337
950
$59,040
Medium
No
189
Boston-Cambridge-Newton, MA-NH
336
9,360
$63,060
Large
No
190
Bismarck, ND
335
350
$56,960
Small
No
190
Clarksville, TN-KY
335
730
$49,570
Medium
No
190
State College, PA
335
300
$47,240
Small
No
193
Wausau, WI
334
340
$53,100
Small
No
193
Wilmington, NC
334
1,130
$48,100
Medium
No
195
Grand Junction, CO
333
400
$58,200
Small
No
195
Hickory-Lenoir-Morganton, NC
333
950
$46,860
Medium
No
195
Houston-Pasadena-The Woodlands, TX
333
14,910
$50,940
Large
No
195
Norwich-New London-Willimantic, CT
333
630
$58,950
Medium
No
199
Akron, OH
331
1,580
$52,900
Medium
No
199
Chambersburg, PA
331
400
$48,270
Small
No
199
Janesville-Beloit, WI
331
390
$53,240
Small
No
199
Rockford, IL
331
730
$48,110
Medium
No
199
Toledo, OH
331
1,350
$47,090
Medium
No
204
Brownsville-Harlingen, TX
329
780
$39,160
Medium
No
204
Gulfport-Biloxi, MS
329
980
$39,120
Medium
No
204
Kokomo, IN
329
200
$48,580
Small
No
207
Fargo, ND-MN
328
600
$59,510
Medium
No
207
Omaha, NE-IA
328
2,250
$54,230
Large
No
209
Asheville, NC
326
950
$47,900
Medium
No
210
Miami-Fort Lauderdale-West Palm Beach, FL
325
11,970
$49,550
Large
No
210
Sebastian-Vero Beach-West Vero Corridor, FL
325
370
$47,950
Small
No
212
Greenville-Anderson-Greer, SC
324
2,310
$48,120
Large
No
212
Lawton, OK
324
260
$45,010
Small
No
212
Oklahoma City, OK
324
3,340
$46,820
Large
No
215
Detroit-Warren-Dearborn, MI
322
9,520
$56,000
Large
No
215
Flint, MI
322
920
$48,680
Medium
No
215
Muncie, IN
322
260
$47,360
Small
No
215
Portland-South Portland, ME
322
1,360
$59,090
Medium
No
219
Blacksburg-Christiansburg-Radford, VA
320
440
$48,500
Small
No
219
Boise City, ID
320
2,030
$48,630
Medium
No
219
Lake Charles, LA
320
520
$45,540
Small
No
219
New York-Newark-Jersey City, NY-NJ
320
28,420
$57,760
Large
No
219
Tallahassee, FL
320
870
$45,640
Medium
No
224
Coeur d'Alene, ID
319
490
$50,910
Small
No
224
Fond du Lac, WI
319
260
$54,300
Small
No
224
McAllen-Edinburg-Mission, TX
319
1,620
$39,920
Medium
No
224
Memphis, TN-MS-AR
319
2,980
$50,490
Large
No
224
Tulsa, OK
319
2,430
$47,410
Large
No
229
Harrisonburg, VA
318
340
$48,930
Small
No
229
Nashville-Davidson--Murfreesboro--Franklin, TN
318
5,150
$58,700
Large
No
229
Philadelphia-Camden-Wilmington, PA-NJ-DE-MD
318
12,700
$58,460
Large
No
229
Rochester, NY
318
2,310
$58,530
Large
No
233
Binghamton, NY
317
520
$47,870
Small
No
233
Fort Smith, AR-OK
317
550
$42,030
Small
No
233
Palm Bay-Melbourne-Titusville, FL
317
1,460
$47,670
Medium
No
236
Harrisburg-Carlisle, PA
316
1,410
$49,540
Medium
No
236
Waterloo-Cedar Falls, IA
316
430
$48,720
Small
No
238
Providence-Warwick, RI-MA
315
3,700
$51,970
Large
No
239
Kansas City, MO-KS
314
5,380
$53,790
Large
No
239
Pensacola-Ferry Pass-Brent, FL
314
1,190
$46,290
Medium
No
239
Phoenix-Mesa-Chandler, AZ
314
11,340
$50,090
Large
No
242
North Port-Bradenton-Sarasota, FL
313
2,110
$51,970
Medium
No
243
Dallas-Fort Worth-Arlington, TX
312
17,690
$49,720
Large
No
244
Hot Springs, AR
310
260
$40,430
Small
No
244
Terre Haute, IN
310
410
$46,840
Small
No
246
Crestview-Fort Walton Beach-Destin, FL
309
740
$47,760
Medium
No
246
Hilton Head Island-Bluffton-Port Royal, SC
309
560
$50,920
Small
No
246
Missoula, MT
309
350
$59,650
Small
No
246
Sherman-Denison, TX
309
360
$49,030
Small
No
250
Macon-Bibb County, GA
308
540
$47,700
Small
No
251
Albuquerque, NM
307
2,320
$48,820
Medium
No
251
Baltimore-Columbia-Towson, MD
307
6,340
$57,630
Large
No
251
El Centro, CA
307
320
$54,330
Small
No
251
Logan, UT-ID
307
380
$46,490
Small
No
255
Appleton, WI
306
640
$58,060
Small
No
256
Buffalo-Cheektowaga, NY
305
2,590
$48,550
Large
No
256
Decatur, IL
305
240
$47,880
Small
No
256
Gainesville, FL
305
800
$47,460
Medium
No
256
Las Vegas-Henderson-North Las Vegas, NV
305
4,970
$47,650
Large
No
256
Minot, ND
305
210
$60,020
Small
No
256
Raleigh-Cary, NC
305
3,650
$50,600
Large
No
262
Beaumont-Port Arthur, TX
304
890
$47,050
Medium
No
262
Deltona-Daytona Beach-Ormond Beach, FL
304
1,700
$46,810
Medium
No
262
Huntington-Ashland, WV-KY-OH
304
920
$37,240
Medium
No
262
Lewiston, ID-WA
304
190
$48,870
Small
No
262
Port St. Lucie, FL
304
1,200
$49,380
Medium
No
262
Tampa-St. Petersburg-Clearwater, FL
304
7,380
$47,880
Large
No
268
Des Moines-West Des Moines, IA
303
1,870
$60,470
Medium
No
268
Owensboro, KY
303
290
$43,900
Small
No
268
Provo-Orem-Lehi, UT
303
1,590
$43,980
Medium
No
268
Scranton--Wilkes-Barre, PA
303
1,300
$47,600
Medium
No
272
Kiryas Joel-Poughkeepsie-Newburgh, NY
302
1,530
$56,260
Medium
No
272
Trenton-Princeton, NJ
302
800
$56,550
Medium
No
274
Bowling Green, KY
301
470
$42,860
Small
No
275
Killeen-Temple, TX
300
1,110
$45,870
Medium
No
276
Davenport-Moline-Rock Island, IA-IL
299
980
$47,880
Medium
No
277
Naples-Marco Island, FL
298
940
$51,320
Medium
No
277
Punta Gorda, FL
298
520
$46,190
Small
No
279
Kingston, NY
297
440
$53,290
Small
No
280
Vineland, NJ
296
330
$48,670
Small
No
281
Chicago-Naperville-Elgin, IL-IN
295
20,140
$55,320
Large
No
282
Albany-Schenectady-Troy, NY
294
2,140
$55,500
Medium
No
282
Sheboygan, WI
294
310
$51,080
Small
No
284
Savannah, GA
293
1,000
$52,230
Medium
No
284
Spartanburg, SC
293
970
$48,610
Medium
No
286
Johnstown, PA
292
330
$46,350
Small
No
287
Greensboro-High Point, NC
291
2,110
$48,770
Medium
No
287
Lewiston-Auburn, ME
291
280
$56,370
Small
No
287
Lima, OH
291
270
$45,740
Small
No
287
New Haven, CT
291
1,320
$59,760
Medium
No
287
Utica-Rome, NY
291
670
$47,770
Medium
No
292
Cape Coral-Fort Myers, FL
290
1,900
$46,840
Medium
No
293
Waco, TX
289
730
$46,790
Medium
No
294
Evansville, IN
288
740
$47,920
Medium
No
295
Jefferson City, MO
287
420
$47,010
Small
No
295
Shreveport-Bossier City, LA
287
930
$45,990
Medium
No
297
San Antonio-New Braunfels, TX
286
6,320
$46,880
Large
No
298
Reno, NV
285
1,580
$50,190
Medium
No
299
Alexandria, LA
284
340
$44,900
Small
No
299
Orlando-Kissimmee-Sanford, FL
284
6,480
$47,850
Large
No
299
Springfield, IL
284
550
$48,810
Small
No
299
Winchester, VA-WV
284
410
$57,570
Small
No
303
Jacksonville, FL
283
4,160
$51,530
Large
No
303
Louisville/Jefferson County, KY-IN
283
3,640
$47,440
Large
No
305
Fayetteville-Springdale-Rogers, AR
282
1,520
$46,840
Medium
No
306
Bloomington, IL
281
440
$46,260
Small
No
307
College Station-Bryan, TX
280
700
$49,080
Medium
No
307
El Paso, TX
280
2,080
$44,250
Medium
No
307
Ocala, FL
280
1,030
$45,900
Medium
No
310
Elizabethtown, KY
279
350
$41,630
Small
No
310
Indianapolis-Carmel-Greenwood, IN
279
5,600
$50,530
Large
No
310
Lakeland-Winter Haven, FL
279
1,820
$45,900
Medium
No
313
Morgantown, WV
278
360
$37,060
Small
No
314
St. Louis, MO-IL
277
7,590
$58,190
Large
No
315
Battle Creek, MI
276
340
$47,720
Small
No
315
Pittsburgh, PA
276
6,430
$48,900
Large
No
315
Yuma, AZ
276
540
$44,510
Small
No
318
Paducah, KY-IL
275
290
$43,260
Small
No
319
Corpus Christi, TX
274
1,090
$44,710
Medium
No
319
Fort Wayne, IN
274
1,240
$49,810
Medium
No
321
Jonesboro, AR
273
350
$44,830
Small
No
321
Mankato, MN
273
290
$48,450
Small
No
321
Myrtle Beach-Conway-North Myrtle Beach, SC
273
1,040
$45,360
Medium
No
321
St. George, UT
273
550
$47,430
Small
No
325
Elmira, NY
271
210
$46,720
Small
No
325
St. Joseph, MO-KS
271
330
$47,180
Small
No
327
Casper, WY
269
260
$59,530
Small
No
328
Dubuque, IA
268
290
$61,030
Small
No
329
Erie, PA
267
670
$46,840
Medium
No
330
Panama City-Panama City Beach, FL
266
620
$43,730
Small
No
330
Peoria, IL
266
1,040
$47,750
Medium
No
330
Syracuse, NY
266
1,650
$49,410
Medium
No
330
Twin Falls, ID
266
360
$46,990
Small
No
334
Hattiesburg, MS
265
430
$37,700
Small
No
334
Jackson, TN
265
520
$49,910
Small
No
334
Joplin, MO-KS
265
590
$46,320
Small
No
334
Kahului-Wailuku, HI
265
440
$57,180
Small
No
334
Little Rock-North Little Rock-Conway, AR
265
2,160
$46,130
Medium
No
339
Bangor, ME
262
450
$50,170
Small
No
339
Longview, TX
262
800
$46,400
Medium
No
341
Ogden, UT
261
1,870
$46,650
Medium
No
342
Charlotte-Concord-Gastonia, NC-SC
260
7,990
$53,660
Large
No
342
Fairbanks-College, AK
260
270
$61,060
Small
No
344
Glens Falls, NY
259
370
$50,300
Small
No
345
Columbia, MO
258
630
$48,370
Small
No
345
Columbia, SC
258
2,500
$48,080
Medium
No
347
Lancaster, PA
256
1,540
$50,530
Medium
No
348
Billings, MT
255
650
$60,150
Small
No
348
Wheeling, WV-OH
255
400
$42,030
Small
No
350
Grand Rapids-Wyoming-Kentwood, MI
252
3,340
$49,310
Large
No
350
Lexington-Fayette, KY
252
1,530
$46,080
Medium
No
352
Elkhart-Goshen, IN
251
530
$49,990
Small
No
353
Burlington-South Burlington, VT
250
660
$57,580
Small
No
354
Albany, GA
248
420
$49,710
Small
No
354
Charleston-North Charleston, SC
248
2,510
$49,120
Medium
No
354
Texarkana, TX-AR
248
410
$44,940
Small
No
357
Laredo, TX
247
640
$39,450
Medium
No
357
Salisbury, MD
247
390
$54,840
Small
No
357
Williamsport, PA
247
340
$48,450
Small
No
360
Saginaw, MI
243
580
$47,320
Small
No
361
Cape Girardeau, MO-IL
242
310
$48,690
Small
No
361
Grand Island, NE
242
260
$53,250
Small
No
361
St. Cloud, MN
242
640
$48,490
Small
No
364
Kankakee, IL
240
320
$45,190
Small
No
365
Florence, SC
238
600
$46,130
Small
No
365
Victoria, TX
238
300
$45,060
Small
No
365
Wichita Falls, TX
238
440
$44,780
Small
No
368
Jackson, MS
237
1,900
$38,040
Medium
No
369
Salt Lake City-Murray, UT
236
3,910
$47,280
Large
No
370
Midland, TX
231
600
$49,990
Small
No
371
Fayetteville, NC
224
1,220
$46,870
Medium
No
372
Idaho Falls, ID
222
580
$48,320
Small
No
373
Altoona, PA
220
400
$46,160
Small
No
373
Watertown-Fort Drum, NY
220
350
$47,280
Small
No
375
Lubbock, TX
216
1,180
$44,950
Medium
No
376
San Angelo, TX
210
410
$46,130
Small
No
377
Amarillo, TX
209
930
$45,860
Medium
No
377
Beckley, WV
209
380
$37,340
Small
No
377
Farmington, NM
209
400
$46,660
Small
No
380
Charleston, WV
207
690
$41,390
Small
No
380
Manchester-Nashua, NH
207
1,540
$59,720
Medium
No
382
Springfield, MO
204
1,840
$49,570
Medium
No
383
Parkersburg-Vienna, WV
201
330
$37,250
Small
No
384
Abilene, TX
193
650
$46,190
Small
No
385
Tyler, TX
189
850
$44,590
Medium
No
386
Odessa, TX
187
640
$47,510
Small
No
387
Carson City, NV
173
270
$54,270
Small
No

Five of the 10 Least-Served Large Metros Are in California

None of the 56 metros with a million or more residents reaches the repair desert bar. Twenty-four have more vehicles per technician than the national ratio of 334. San Diego has the most at 468, followed by Portland (447), San Jose (439), Seattle (430) and Riverside (415). Five of the 10 are in California. Salt Lake City has the fewest at 236, followed by Grand Rapids, Michigan (252), and Charlotte, North Carolina (260).

1
San Diego-Chula Vista-Carlsbad, CA
468
27
2,274
$64,320
2
Portland-Vancouver-Hillsboro, OR-WA
447
39
1,780
$60,450
3
San Jose-Sunnyvale-Santa Clara, CA
439
44
2,188
$77,840
4
Seattle-Tacoma-Bellevue, WA
430
51
2,202
$59,290
5
Riverside-San Bernardino-Ontario, CA
415
64
1,932
$64,210
6
San Francisco-Oakland-Fremont, CA
412
65
1,118
$76,030
7
Birmingham, AL
411
66
2,281
$47,830
8
Columbus, OH
401
76
1,427
$56,150
9
Fresno, CA
390
86
2,380
$52,000
10
Hartford-West Hartford-East Hartford, CT
381
100
1,372
$58,910

Repair Prices Have Outpaced Insurance Premiums

The BLS consumer price index for motor vehicle maintenance and repair rose 56% from January 2020 to September 2026. The motor vehicle insurance index rose 48% over the same period, and prices overall rose 31%.

Repair prices passed car insurance prices in June 2026, up 56% since 2020

Insurance prices peaked in February 2026, up 56% from January 2022, and have fallen 5.7% since. Repair prices kept rising, and measured from January 2020, they passed insurance prices in June 2026. Lower premiums help drivers at renewal. A long stay in the shop costs the same either way. Newer cars add another layer of expense, covered in MoneyGeek’s analysis of repair costs for cars with advanced driver-assistance systems.

coins2 icon
WHAT A LONG REPAIR CAN COST DRIVERS

When a repair runs long, your rental reimbursement limits decide who pays for the substitute car. Say your policy pays $30 a day for up to 30 days, or $900 in total, and the rental costs $50 a day.

  • A 20-day repair: You pay the $20 daily difference, or $400.
  • A 40-day repair: You pay $20 a day for the first 30 days ($600) and the full $50 for the last 10 ($500), or $1,100.

The extra 20 days cost you $700 in this example. Limits and rental rates vary by insurer and location.

How to Prepare for a Repair in a Low-Capacity Area

If you live in Oregon, Washington, Alabama or one of the 17 repair-desert metros, take these steps before you need a major repair:

  1. 1
    Check rental reimbursement limits.

    Look at the daily limit, the total limit and any time cap, and consider raising them if repairs in your area often take weeks.

  2. 2
    Ask your insurer about its repair network.

    Many insurers work with direct-repair shops. Ask which nearby shops are in the network and whether they have open capacity.

  3. 3
    Schedule maintenance early.

    In areas with few technicians, booking routine service weeks ahead gives the shop room to fit you in.

  4. 4
    Know the claims steps before you need them.

    MoneyGeek’s guide on how to file a car insurance claim covers what to document and when. Claims handling also varies by company; MoneyGeek ranks the insurers with the best claims service.

Which Metros Are Car Repair Deserts?

These 17 metros have at least 502 household vehicles per automotive service technician, 1.5 times the national ratio of 334.

Florence-Muscle Shoals
AL
240
534
Small
Chico
CA
320
507
Small
Hanford-Corcoran
CA
170
519
Small
Merced
CA
330
538
Medium
Napa
CA
160
639
Small
Wildwood-The Villages
FL
180
570
Small
Hinesville
GA
110
520
Small
Springfield
OH
200
528
Small
Albany
OR
170
638
Small
Bend
OR
440
509
Medium
Corvallis
OR
130
567
Small
Grants Pass
OR
140
566
Small
Salem
OR
590
535
Medium
Bellingham
WA
360
525
Small
Olympia-Lacey-Tumwater
WA
450
540
Medium
Walla Walla
WA
90
528
Small
Weirton-Steubenville
WV-OH
170
512
Small

Methodology

MoneyGeek ranked the 50 states on three ratios and 387 metropolitan statistical areas on one. Washington, D.C., and the five Puerto Rico metros are excluded.

About Nathan Paulus


Nathan Paulus, Head of Content and SEO, MoneyGeek

Nathan Paulus is the Head of Marketing and Brand Partnerships at MoneyGeek, where he leads content strategy and conducts original data research across insurance, consumer costs, transportation safety, housing, public policy and personal finance. He reviews studies for methodology, source quality and factual accuracy.

Research and Analysis

In more than six years at MoneyGeek, Nathan has published more than 100 original studies and explanatory guides. His insurance research includes 50-state comparisons of health care outcomes, costs and access, and an analysis of how uninsured rates track with state Medicaid expansion decisions and electoral patterns. 

He has analyzed full-coverage auto rates across major insurers in all 50 states and tracked how premium trends relate to industry underwriting losses. That research draws on combined ratio data from Fitch Ratings and AM Best, plus the Bureau of Labor Statistics CPI figures. Beyond insurance, his work spans vehicle pricing trends across the U.S. new car market, summer traffic fatality rates by state, homeowner underinsurance ratios using mortgage and policy data, and housing affordability across all 50 states.

His research has been cited by Bloomberg, the Los Angeles Times, Forbes, Fast Company, the San Francisco Chronicle, USA Today and NBC Los Angeles. Harvard, MIT, Stanford and Yale have referenced his work.

Career

Nathan traces his interest in personal finance back to his grandmother, who ran her household on a simple rule: spend less than you make and save the difference before anything else. That rule shows up in his work today. His writing skips jargon and complex strategy in favor of the basics that help someone living paycheck to paycheck.

He joined MoneyGeek in July 2020 as Director of Content Marketing, where he led the content team and oversaw data journalism production across insurance and personal finance verticals. A promotion to Head of Marketing and Communications followed in December 2023. The new role added digital PR and communications strategy to his responsibilities. He was appointed Head of Content and SEO in January 2025.

Before MoneyGeek, Nathan served as Director of Content Marketing and SEO at Ventrix Advertising, where he helped build two content sites from scratch, contributed to link-building programs that generated more than 1,500 unique referring domains within a year and co-managed a marketing team of more than 20 people. Two and a half years at ABUV Media preceded that role. He advanced from Marketing Research Analyst to Senior Marketing Tactics Analyst, where he built expertise in audience research, content strategy and SEO.


Sources