ACA Subsidy Cliff 2027: $1 Over the Limit Costs a 60-Year-Old $11,652 a Year

Updated: November 10, 2026

Advertising & Editorial Disclosure

A single 60-year-old who earns $63,840 in 2027 pays no more than $6,524 a year for the benchmark Silver plan on an Affordable Care Act (ACA) marketplace. One dollar more, and the premium tax credit stops. The same plan then costs its full price, an average of $18,176 a year, or $11,652 more. That's $971 more every month.

That jump is the ACA subsidy cliff. Federal premium tax credits end at 400% of the federal poverty level: $63,840 for one person and $86,560 for a couple in 48 states and D.C. for 2027 coverage. The expanded credits that began in 2021 had removed that limit. They expired at the end of 2025, and 2027 is the second year without them.

Age sets the size of the fall. MoneyGeek measured the cliff at ages 26, 40, 50 and 60 in all 50 states and D.C. The average cliff at 26 is $867, and 15 states and D.C. have none. A 60-year-old's is more than 13 times as large.

The cliff grew from 2026, the first year without the expanded credits. At 60, it averaged $9,814 for 2026 coverage. For 2027, it's $11,652, up 18.7%. Benchmark premiums at 60 rose 13.3%, while the most a buyer pays at the limit rose 4.6%.

More marketplace shoppers pay full price than before the credits expired. CMS data shows 3.1 million people picked a 2026 marketplace plan without a tax credit, up from 1.9 million in 2025. These figures come from MoneyGeek's analysis of 2027 benchmark plans, the second-lowest-cost Silver plan in each area, which sets tax credit amounts. For the average price of every Silver plan, see MoneyGeek's study of 2027 ACA premiums.

mglogo icon
STUDY FINDINGS
  • $1 over the limit costs a 60-year-old $11,652 a year. A single 60-year-old pays no more than $6,524 for the benchmark Silver plan at $63,840 of income. One dollar more, and the full price averages $18,176.
  • The cliff at 60 grew 18.7% from 2026. It rose from $9,814 to $11,652. At 40, it rose 50%, from $1,655 to $2,482.
  • The cliff grows with age. It averages $867 at 26, $2,482 at 40, $5,736 at 50 and $11,652 at 60.
  • Many young adults face no cliff. At 26, the full-price benchmark plan costs less than the capped amount in 15 states and D.C.
  • At 60, the cliff tops $20,000 in three states. Alaska ($24,072), West Virginia ($23,711) and Wyoming ($23,185) have the largest jumps.
  • Massachusetts has the smallest cliff at 60, $4,975. Maryland ($6,023) and New Hampshire ($6,260) follow.
  • Couples fall further. For two 60-year-olds, $1 over $86,560 adds $27,471 a year on average, and $51,624 in West Virginia.
  • The full price at 60 equals 28.5% of income at the limit. In West Virginia, it's 47.4%.
  • 3.1 million people picked a 2026 plan without a tax credit. That's 13.4% of plan selections, up from 1.9 million (8.0%) in 2025.

The ACA Subsidy Cliff by Age

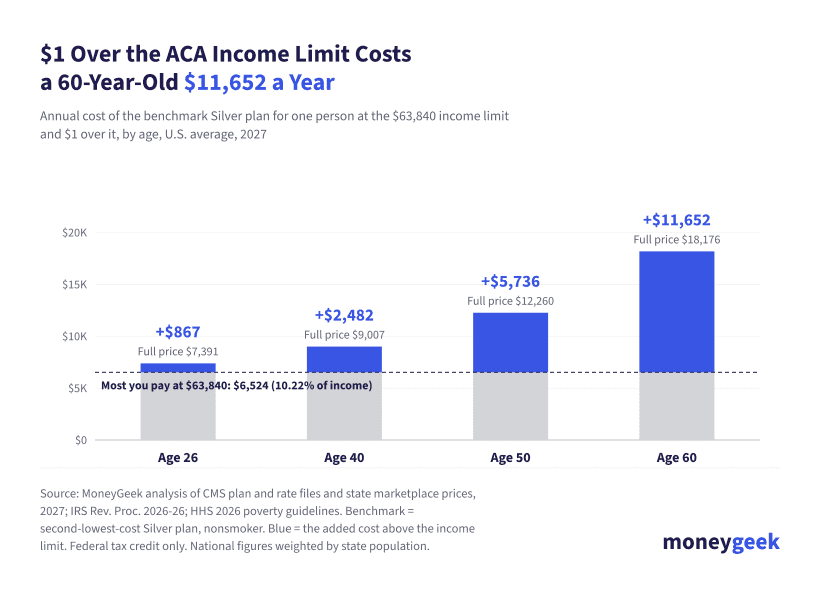
Earning $1 over the income limit costs a single 60-year-old $11,652 a year in 2027, on average. A 26-year-old in the same spot pays $867 more. Premium tax credits stop at the same income for everyone. The benchmark plan's full price rises with age.

$1 over the 2027 ACA income limit costs a 60-year-old $11,652 a year, compared with $867 at age 26.

Up to the limit, a buyer pays no more than 10.22% of income for the benchmark plan, the second-lowest-cost Silver plan where they live, under IRS Rev. Proc. 2026-26. At $63,840, that's $6,524 a year at any age. Above the limit, the buyer pays the plan's full price. Under ACA age rating, the oldest adults can be charged three times what a 21-year-old pays, and the full price for a 60-year-old averages twice the price for a 40-year-old.

26
$7,391
$6,524
$867
35 states
40
$9,007
$6,524
$2,482
46 states and D.C.
50
$12,260
$6,524
$5,736
50 states and D.C.
60
$18,176
$6,524
$11,652
50 states and D.C.

At 26, the full-price benchmark plan costs less than $6,524 a year in 15 states and D.C. A 26-year-old there gets no tax credit at $63,840 of income, and there's no credit to lose one dollar later. By 50, every state has a cliff.

At 60, the full price equals 28.5% of income at the limit, on average, and 47.4% in West Virginia. The full price wouldn't fall to 10.22% of income until a single 60-year-old earned $177,852. MoneyGeek's study of ACA premiums at age 59 puts the jump at $10,951 a year at 59.

Insurers in New York and Vermont charge every adult the same rate. Their cliffs are the same at every age: $6,357 in New York and $9,236 in Vermont. Vermont's cliff is the largest of any state at 26 and at 40.

The ACA Subsidy Cliff by State

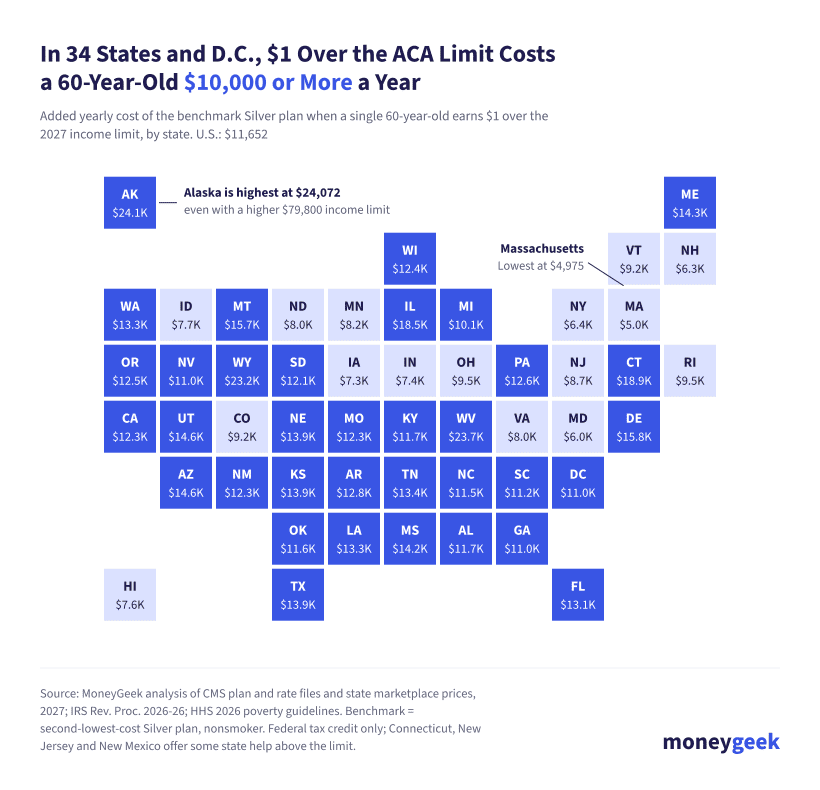
Alaska has the largest subsidy cliff at 60 for 2027. Its higher income limit, $79,800, raises what a buyer pays at the limit to $8,156 a year, and earning $1 more still adds $24,072 to a single 60-year-old's benchmark premium. West Virginia ($23,711) and Wyoming ($23,185) are the other states above $20,000. At 60, the cliff tops $10,000 in 34 states and D.C.

$1 over the 2027 ACA limit costs a 60-year-old $10,000 or more in 34 states and D.C.

Massachusetts has the smallest cliff at 60, $4,975, followed by Maryland ($6,023) and New Hampshire ($6,260).

Each age column shows the added yearly cost of the benchmark Silver plan when a single person earns $1 over the 2027 income limit. A $0 means the full price is less than the capped amount at that age. The last column compares the cliff at 60 with 2026.

1
Alaska‡
$4,004
$7,020
$13,053
$24,072
+$5,524
2
West Virginia
$4,883
$7,713
$13,372
$23,711
+$2,695
3
Wyoming
$4,685
$7,466
$13,027
$23,185
+$2,199
4
Connecticut
$3,061
$5,439
$10,194
$18,881
+$3,089
5
Illinois**
$2,922
$5,265
$9,951
$18,512
+$2,192
6
Delaware
$1,902
$3,992
$8,172
$15,808
+$4,416
7
Montana
$1,857
$3,936
$8,094
$15,690
+$4,703
8
Utah†
$3,089
$3,907
$8,477
$14,634
+$2,562
9
Arizona
$1,452
$3,431
$7,388
$14,617
+$3,422
10
Maine
$1,315
$3,260
$7,149
$14,254
+$2,072
11
Mississippi
$1,287
$3,224
$7,099
$14,178
+$3,516
12
Kansas
$1,185
$3,098
$6,922
$13,909
+$1,930
13
Texas
$1,174
$3,084
$6,903
$13,881
+$1,497
14
Nebraska
$1,168
$3,076
$6,893
$13,864
+$1,253
15
Tennessee
$1,009
$2,877
$6,615
$13,442
+$1,298
16
Washington*
$958
$2,814
$6,526
$13,307
+$4,086
17
Louisiana
$955
$2,811
$6,521
$13,300
+$1,725
18
Florida
$884
$2,721
$6,397
$13,110
+$751
19
Arkansas
$750
$2,554
$6,163
$12,755
-$733
20
Pennsylvania
$674
$2,459
$6,030
$12,553
+$1,548
21
Oregon
$642
$2,420
$5,975
$12,470
+$4,067
22
Wisconsin
$632
$2,407
$5,957
$12,442
+$2,578
23
Missouri
$591
$2,356
$5,886
$12,334
+$1,239
24
New Mexico
$587
$2,351
$5,880
$12,325
+$1,616
25
California
$579
$2,341
$5,864
$12,302
+$1,497
26
South Dakota
$490
$2,230
$5,710
$12,067
+$1,003
27
Kentucky
$336
$2,038
$5,442
$11,659
+$2,499
28
Alabama
$335
$2,036
$5,439
$11,655
+$1,454
29
Oklahoma
$321
$2,019
$5,414
$11,618
+$1,634
30
North Carolina
$291
$1,981
$5,362
$11,539
+$608
31
South Carolina
$152
$1,808
$5,120
$11,170
+$3,208
32
Georgia
$99
$1,742
$5,028
$11,031
+$1,558
33
D.C.†
$0
$1,609
$5,413
$10,985
+$1,474
34
Nevada
$78
$1,716
$4,991
$10,975
+$1,450
35
Michigan
$0
$1,287
$4,393
$10,065
+$1,932
36
Rhode Island
$0
$1,018
$4,016
$9,494
+$2,825
37
Ohio
$0
$1,011
$4,006
$9,478
+$2,089
38
Vermont***
$9,236
$9,236
$9,236
$9,236
-$117
39
Colorado
$0
$886
$3,832
$9,213
+$1,244
40
New Jersey
$0
$645
$3,495
$8,700
+$1,992
41
Minnesota
$0
$425
$3,187
$8,233
+$1,120
42
North Dakota
$0
$330
$3,055
$8,032
+$588
43
Virginia
$0
$294
$3,005
$7,956
+$1,985
44
Idaho
$0
$176
$2,839
$7,704
+$1,418
45
Hawaii‡
$0
$0
$2,451
$7,625
+$953
46
Indiana
$0
$39
$2,648
$7,414
+$1,426
47
Iowa
$0
$0
$2,569
$7,294
+$313
48
New York***
$6,357
$6,357
$6,357
$6,357
+$3,294
49
New Hampshire
$0
$0
$1,889
$6,260
+$1,941
50
Maryland
$0
$0
$1,733
$6,023
+$1,696
51
Massachusetts†
$0
$249
$1,941
$4,975
+$1,093

How the Subsidy Cliff Changed From 2026

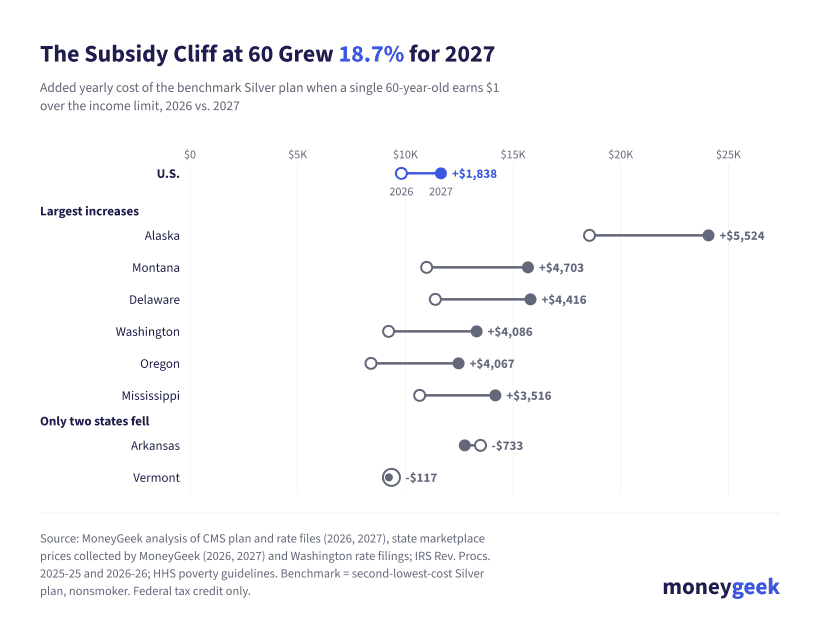
The cliff at 60 grew 18.7% for 2027, from $9,814 to $11,652, on average. Benchmark premiums for a 60-year-old rose 13.3%, about three times the 4.6% increase in what a buyer pays at the limit, now $6,524.

The ACA subsidy cliff at 60 grew 18.7% for 2027, with the largest increase in Alaska.

The cliff at 60 grew in 48 states and D.C. Alaska had the largest increase, $5,524, and joined West Virginia and Wyoming above $20,000. Montana ($4,703) and Delaware ($4,416) followed.

It shrank in two states. Arkansas's cliff fell $733 after its benchmark premium dropped 2.2%. Vermont's fell $117 because its premiums barely changed while the cap rose.

At 40, the cliff grew 50%, from $1,655 to $2,482. It now applies in 46 states and D.C., up from 40 states and D.C. in 2026.

How the Cliff Hits Couples

A married couple's income limit for 2027 is $86,560 in 48 states and D.C. At that income, two 60-year-olds pay no more than $8,846 a year for benchmark coverage. One dollar more, and they pay the full price of two benchmark plans, an average of $36,318 a year. The jump is $27,471.

West Virginia has the largest couples' cliff at 60, $51,624 a year. Massachusetts has the smallest, $14,153. For a couple who are both 50, the cliff averages $15,654.

These figures assume both spouses buy the benchmark plan and count the federal tax credit only. Alaska and Hawaii, which use higher poverty guidelines, aren't included in the couples figures.

Who Pays Full Price for Marketplace Coverage

CMS data shows 3,095,104 people picked a 2026 marketplace plan without a premium tax credit, 13.4% of the 23.1 million plan selections. In 2025, when the expanded credits had no income limit, 1,939,576 people did, or 8.0%. These counts include anyone who didn't receive a credit for any reason. Some didn't apply for one.

Paid enrollment fell too. A KFF analysis of CMS data shows February 2026 effectuated enrollment, the count of people who paid their premium, dropped to 19.2 million from 21.8 million a year earlier, a 12% decline. The share of plan selections that turned into paid coverage fell from 90% to 83%.

The largest cliffs fall on buyers closest to Medicare age. Adults 55 to 64 accounted for 5.2 million 2026 plan selections, or 22.4%, CMS open enrollment data shows.

States That Help Above the Income Limit

The figures in this study count the federal tax credit only. A few states offer their own premium help to some buyers above 400% of the poverty level for 2027:

  • New Jersey: New Jersey Health Plan Savings covers households with income up to 600% of the poverty level, $95,760 for one person, the New Jersey Department of Banking and Insurance says. Open enrollment on Get Covered New Jersey runs through Jan. 31, 2027.
  • Connecticut: Enrollees with income above 400% and up to 500% of the poverty level get state help that replaces half of the expanded federal credit they lost, CT Mirror reported. Everyone who qualified in 2026 qualifies again in 2027, the outlet reported.
  • New Mexico: State premium assistance through beWellnm runs through June 30, 2027, beWellnm says. New Mexico's program has helped buyers above 400% of the poverty level since the expanded federal credits expired.

Other state programs, such as California's and Maryland's, stop at or below 400% of the poverty level. Check your state's marketplace for 2027 amounts before you rule out help.

How to Plan Around the Subsidy Cliff

The cliff turns a small change in income into a large change in premium. These five steps can help you plan for 2027.

  1. 1
    Estimate your 2027 income before you enroll.

    Your tax credit depends on the income you expect for the whole year, including most withdrawals from traditional IRAs and 401(k)s. Enroll by Dec. 15 on HealthCare.gov for coverage that starts Jan. 1; state-run marketplaces set their own deadlines.

  2. 2
    Report income changes during the year.

    If your income ends up above the limit, you repay every dollar of advance credit for the year when you file taxes. The repayment caps that once limited that bill are gone starting with tax year 2026, the IRS says. Updating your marketplace application stops the advance credit for the months left in the year.

  3. 3
    Lower your counted income if you're close to the limit.

    Contributions to a pretax 401(k), a deductible traditional IRA or an HSA can bring counted income under $63,840. MoneyGeek's age 59 study covers which income counts for buyers in their late 50s.

  4. 4
    Check the full price for your age.

    In states such as Colorado, Michigan and Ohio, a 26-year-old's full-price benchmark plan costs less than the $6,524 cap at the limit. Compare your state's full price at your age with 10.22% of your income before you plan around the cliff.

  5. 5
    Look for state help.

    New Jersey, Connecticut and New Mexico offer premium help to some buyers above 400% of the poverty level for 2027. Your state marketplace shows what you qualify for when you apply.

Methodology

MoneyGeek measured the annual full price of the benchmark Silver plan for a single nonsmoker at ages 26, 40, 50 and 60 in each of the 50 states and D.C. for the 2027 plan year. It compared that price with the most a buyer pays for the same plan at the federal income limit. Each H3 below is a collapsible section on the page.

About Nathan Paulus


Nathan Paulus, Head of Content and SEO, MoneyGeek

Nathan Paulus is the Head of Marketing and Brand Partnerships at MoneyGeek, where he leads content strategy and conducts original data research across insurance, consumer costs, transportation safety, housing, public policy and personal finance. He reviews studies for methodology, source quality and factual accuracy.

Research and Analysis

In more than six years at MoneyGeek, Nathan has published more than 100 original studies and explanatory guides. His insurance research includes 50-state comparisons of health care outcomes, costs and access, and an analysis of how uninsured rates track with state Medicaid expansion decisions and electoral patterns. 

He has analyzed full-coverage auto rates across major insurers in all 50 states and tracked how premium trends relate to industry underwriting losses. That research draws on combined ratio data from Fitch Ratings and AM Best, plus the Bureau of Labor Statistics CPI figures. Beyond insurance, his work spans vehicle pricing trends across the U.S. new car market, summer traffic fatality rates by state, homeowner underinsurance ratios using mortgage and policy data, and housing affordability across all 50 states.

His research has been cited by Bloomberg, the Los Angeles Times, Forbes, Fast Company, the San Francisco Chronicle, USA Today and NBC Los Angeles. Harvard, MIT, Stanford and Yale have referenced his work.

Career

Nathan traces his interest in personal finance back to his grandmother, who ran her household on a simple rule: spend less than you make and save the difference before anything else. That rule shows up in his work today. His writing skips jargon and complex strategy in favor of the basics that help someone living paycheck to paycheck.

He joined MoneyGeek in July 2020 as Director of Content Marketing, where he led the content team and oversaw data journalism production across insurance and personal finance verticals. A promotion to Head of Marketing and Communications followed in December 2023. The new role added digital PR and communications strategy to his responsibilities. He was appointed Head of Content and SEO in January 2025.

Before MoneyGeek, Nathan served as Director of Content Marketing and SEO at Ventrix Advertising, where he helped build two content sites from scratch, contributed to link-building programs that generated more than 1,500 unique referring domains within a year and co-managed a marketing team of more than 20 people. Two and a half years at ABUV Media preceded that role. He advanced from Marketing Research Analyst to Senior Marketing Tactics Analyst, where he built expertise in audience research, content strategy and SEO.


Sources