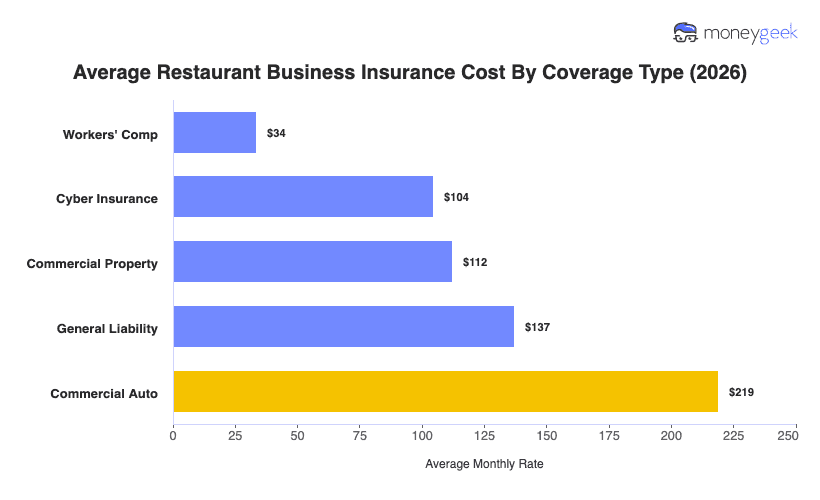
Estimate Average Business Insurance Costs for Your Restaurant Company

Plug in your coverage type, state, employee count and vehicle type (if you need commercial auto coverage) to get a cost estimate built around your operation. No personal information is required, and workers' comp estimates are calculated per employee.

Select Coverage Type
Select State
Select Employee Count
Select Vehicle Type
Monthly Rate Estimate—

How Much Does Restaurant Business Insurance Cost?

Full-service restaurants average around $124 monthly across five coverage types, or $1,485 annually, based on MoneyGeek's cost study. For food business insurance costs, we modeled quotes for businesses with 1 to 4 employees, $1 million per occurrence limits and 16 vehicle types for commercial auto, covering all 50 states and Washington, D.C.

Among individual policies, workers' comp comes in lowest at around $34 monthly, where premiums are based on payroll and a lean kitchen and floor crew keeps that base down. Commercial auto runs highest at around $226, reflecting the liability of vehicles used for delivery or private dining events. The table below breaks out figures by coverage type, but treat them as benchmarks, not quotes.

Workers' Comp$34$40370%115
Cyber Insurance$104$1,253-25%309
Commercial Property$112$1,34610%274
General Liability$137$1,64512%294
Commercial Auto$219$2,625-34%350

We analyzed quote data from major U.S. commercial insurance providers and modeled standardized premium estimates across business profiles representing around 95% of the market. Results are designed to provide a consistent national benchmark showing how premiums vary by key baseline factors including business size, restaurant profession type, location and vehicle type for operations that use commercial vehicles.

Dataset Scope and Assumptions

Our cost modeling uses standardized inputs for consistent comparisons across businesses.

  • Total estimates modeled: just over 6 million standardized pricing estimates
  • Providers analyzed: 10 major insurance providers
  • Geography: all U.S. states including Washington, D.C.
  • Employee count bands: solo practitioners, one to four, five to nine, 10 to 19, and 20 to 49 employees
  • Vehicle types studied: Sedans, SUVs, pickup trucks, vans, taxis, limousines, tractors, food trucks, semi-trucks (non-HAZMAT and HAZMAT), tanker trucks (non-HAZMAT and HAZMAT), buses, box trucks, dump trucks, flatbed trucks
  • Policies studied: general liability, workers' comp, professional liability, commercial auto, commercial property, and cyber insurance
    • General liability: $1 million per occurrence and $2 million aggregate
    • Workers' comp: state required coverage
    • Professional liability: $1 million per claim and $1 million aggregate
    • Commercial auto: minimum coverage
    • Commercial property: personal property coverage limits personalized to industry, business size and state
    • Cyber insurance: $1 million per occurrence and $1 million aggregate

How We Calculated Average Restaurant Business Insurance Costs

Our published averages represent modeled premiums for standardized business profiles and were aggregated in two ways.

  • National benchmark average: The national average cost reflects the modeled premium for a standardized one to four employee business across all restaurant profession categories and states included in our dataset for a standard professional liability policy
  • Segment averages: To show how costs vary, we calculated average modeled premiums for our national base profile and isolated for variables, including:
    • Employee count (business size ranges)
    • Profession / industry categories
    • Vehicle types (for commercial auto)
    • States (including Washington, D.C.)

Segment averages were produced by aggregating modeled pricing trends across the full dataset so readers can compare how premiums shift across profession types and regions.
See our full business insurance methodology.

How Much Does General Liability Insurance Cost for Restaurant Businesses?

General liability covers the slip-and-fall in the dining room, the foodborne illness claim and the alcohol-related incident your bar staff may be held responsible for. General liability costs for full-service restaurants run from around $91 per month in West Virginia to $224 in California, a 147% difference for the same baseline coverage.

That gap is largely explained by dram shop liability. In high-litigation states, a restaurant that serves alcohol to a guest who later causes harm can be held liable for resulting damages, and the higher jury awards those markets generate push premiums up for restaurants running a bar program. A late-night full-service restaurant in Los Angeles carries meaningfully different dram shop exposure than a neighborhood bistro in rural West Virginia that closes at nine. If your restaurant serves alcohol, your state's dram shop framework matters.

West Virginia$91$1,089
Mississippi$92$1,099
South Dakota$95$1,146
Arkansas$98$1,176
Iowa$99$1,188
South Carolina$99$1,191
Idaho$100$1,204
Oklahoma$102$1,221
New Mexico$102$1,225
Wyoming$102$1,226
Alabama$103$1,233
Montana$103$1,238
Louisiana$103$1,242
North Dakota$106$1,271
Kentucky$107$1,281
Nebraska$108$1,300
Kansas$109$1,305
Missouri$115$1,378
Indiana$119$1,429
Utah$120$1,442
Maine$120$1,444
Wisconsin$121$1,454
Tennessee$122$1,462
Ohio$123$1,470
North Carolina$123$1,481
Michigan$130$1,557
Georgia$131$1,568
Texas$136$1,626
Vermont$136$1,630
Arizona$138$1,661
Pennsylvania$145$1,743
Minnesota$148$1,776
Nevada$149$1,785
Rhode Island$149$1,787
Delaware$150$1,795
New Hampshire$153$1,835
Virginia$155$1,861
Florida$160$1,920
Oregon$161$1,926
Illinois$163$1,955
Colorado$166$1,994
Alaska$174$2,092
Hawaii$181$2,161
Maryland$183$2,192
Washington$187$2,250
Connecticut$188$2,255
New Jersey$193$2,315
Massachusetts$203$2,441
New York$218$2,611
District of Columbia$220$2,636
California$224$2,688

How Much Does Workers’ Comp Insurance Cost for Restaurant Businesses?

Few industries generate workers' comp exposure like full-service restaurants. Kitchen crews work around open flames, sharp equipment and hot surfaces, while servers move through crowded dining rooms between back-to-back services. Premiums are calculated per employee, so your total workers' comp cost scales directly with how many people you staff.

Indiana restaurants pay around $19 per employee per month while California restaurants pay around $79, more than four times as much for the same profile. Kitchen and floor staff fall under workers' comp classifications that each state prices independently, and California's base rates reflect both the injury frequency in commercial kitchens, including burns, lacerations and repetitive strain from prep work, and the state's higher medical costs and wage replacement benefits. Running a full kitchen crew across two daily services in California adds up in a way a similarly staffed Indiana restaurant simply doesn't see.

Indiana$19$227
Arkansas$19$231
South Dakota$19$233
Iowa$20$242
Idaho$21$248
Mississippi$21$253
Utah$21$257
Nebraska$22$262
Alabama$22$262
Kansas$22$263
Texas$22$269
Kentucky$23$278
Tennessee$24$289
New Mexico$24$293
Virginia$25$304
North Carolina$27$319
Arizona$27$323
Missouri$27$325
Montana$28$338
Oklahoma$28$338
Wisconsin$29$345
Nevada$29$348
West Virginia$29$349
Maine$29$351
Georgia$30$358
South Carolina$30$364
Oregon$31$368
Louisiana$31$376
Florida$31$378
Vermont$32$388
Colorado$33$400
Minnesota$34$403
Michigan$34$413
New Hampshire$35$418
Maryland$36$431
Rhode Island$36$435
Delaware$41$494
Hawaii$42$500
Pennsylvania$43$518
Illinois$44$523
Alaska$54$653
Massachusetts$57$684
New Jersey$60$715
New York$61$729
Connecticut$61$730
District of Columbia$70$844
California$79$953

How Much Does Commercial Property Insurance Cost for Restaurant Businesses?

A full-service restaurant's kitchen equipment, walk-in coolers, hood systems and dining room buildout represent a substantial investment that a grease fire or equipment failure can put out of service overnight. Monthly commercial property costs run from $98 in North Dakota to $133 in New York, a difference of just $35 across the entire country.

Property premiums tell a different story from GL or workers' comp. Unlike GL, which tracks litigation climate, property premiums follow replacement cost, which is relatively stable nationally for commercial kitchen equipment and dining room buildouts. A hood system costs roughly the same to replace in Fargo as in Manhattan. Your equipment inventory and fire suppression setup matter more to your property premium than the state you operate in.

North Dakota$98$1,179
South Dakota$99$1,190
Nebraska$99$1,192
Iowa$100$1,202
Kansas$100$1,203
Arkansas$101$1,217
Wyoming$102$1,219
West Virginia$102$1,219
Missouri$102$1,228
Mississippi$102$1,229
Oklahoma$103$1,234
Indiana$104$1,243
Kentucky$104$1,243
Montana$104$1,245
New Mexico$104$1,253
Alabama$105$1,257
Wisconsin$106$1,268
Maine$106$1,277
Idaho$107$1,280
Ohio$107$1,282
Tennessee$107$1,283
Michigan$107$1,284
Vermont$107$1,286
Utah$110$1,319
South Carolina$110$1,322
Minnesota$110$1,322
New Hampshire$110$1,325
Georgia$111$1,338
North Carolina$112$1,345
Arizona$112$1,346
Virginia$114$1,370
Nevada$114$1,372
Illinois$116$1,388
Louisiana$116$1,397
Colorado$117$1,398
Delaware$117$1,405
Oregon$118$1,411
Pennsylvania$118$1,417
Texas$119$1,426
Maryland$120$1,443
Washington$121$1,452
Rhode Island$121$1,456
Alaska$124$1,491
Connecticut$125$1,496
Florida$127$1,518
Massachusetts$127$1,522
New Jersey$130$1,555
California$130$1,557
District of Columbia$130$1,561
Hawaii$132$1,583
New York$133$1,601

How Much Does Commercial Auto Insurance Cost for Restaurant Businesses?

Not every full-service restaurant operates vehicles, but those running delivery, transporting supplies for off-site catering or moving equipment between locations carry commercial auto exposure that a personal auto policy won't cover. The average cost of commercial auto insurance run from around $88 per month in Iowa to $169 in Washington D.C., an $81 gap driven by more than just traffic density.

Restaurants in urban markets like D.C., California and New York see higher accident frequency on dense city routes and take on more cargo liability exposure per route. A delivery vehicle loaded with prepared food, beverage orders or catering equipment for a private event represents a different claims profile than a contractor's work truck. If your restaurant uses vehicles only occasionally, such as a single catering van for weekend events, your exposure and premium will look different from an operation running daily delivery routes.

Iowa
$88
$1,060
Idaho
$91
$1,097
Vermont
$98
$1,175
Montana
$100
$1,201
New Mexico
$100
$1,195
Nebraska
$101
$1,211
Alabama
$103
$1,237
Arkansas
$103
$1,233
Mississippi
$103
$1,234
Kansas
$104
$1,253
West Virginia
$104
$1,248
Wisconsin
$104
$1,246
Oklahoma
$105
$1,263
Pennsylvania
$105
$1,259
Kentucky
$109
$1,306
Utah
$109
$1,312
Indiana
$110
$1,324
New Hampshire
$110
$1,315
South Dakota
$110
$1,315
Tennessee
$110
$1,324
South Carolina
$111
$1,339
Hawaii
$113
$1,353
North Dakota
$115
$1,384
Arizona
$117
$1,399
North Carolina
$118
$1,409
Georgia
$119
$1,426
Louisiana
$119
$1,424
Maine
$119
$1,428
Missouri
$120
$1,439
Wyoming
$120
$1,441
Delaware
$121
$1,451
Minnesota
$123
$1,477
Nevada
$125
$1,505
Oregon
$126
$1,508
Virginia
$129
$1,542
Colorado
$130
$1,558
Rhode Island
$135
$1,614
Illinois
$137
$1,642
Ohio
$137
$1,639
Texas
$137
$1,647
Maryland
$145
$1,739
Florida
$148
$1,781
Connecticut
$150
$1,796
Massachusetts
$155
$1,854
New Jersey
$155
$1,865
Washington
$158
$1,893
Michigan
$159
$1,908
Alaska
$161
$1,931
New York
$165
$1,980
California
$166
$1,996
Washington D.C.
$169
$2,032

How Much Does Cyber Insurance Cost for Restaurant Businesses

Full-service restaurants collect more customer data than most owners realize. Payment card information processed through POS systems, reservation details held by booking platforms and loyalty program records all create cyber exposure that a general liability policy doesn't cover. As full-service restaurants have added online reservations, loyalty apps and integrated POS systems, the cyber exposure has grown alongside it.

Monthly cyber insurance costs range from $89 in Alaska, Montana and North Dakota to $129 in Washington D.C., a gap driven partly by differences in breach notification requirements across state lines. But geography matters less for this coverage as your cyber premium tracks your technology footprint more than your state: how many POS terminals you run, whether you use a third-party reservation platform and whether your loyalty program collects payment information. A high-volume restaurant processing hundreds of card transactions per service carries more exposure than its location suggests.

Alaska$89$1,067
Montana$89$1,067
North Dakota$89$1,064
Wyoming$89$1,067
Idaho$91$1,088
South Dakota$91$1,091
West Virginia$91$1,088
Hawaii$93$1,124
Maine$93$1,124
Iowa$94$1,128
Nebraska$94$1,126
New Hampshire$94$1,128
Rhode Island$94$1,126
Vermont$94$1,128
Arkansas$96$1,148
Mississippi$96$1,148
New Mexico$96$1,148
Kansas$98$1,185
Oklahoma$98$1,185
Utah$98$1,185
Alabama$100$1,211
Kentucky$100$1,209
Louisiana$100$1,209
South Carolina$100$1,211
Indiana$104$1,245
Missouri$104$1,249
Tennessee$104$1,247
Wisconsin$104$1,245
Arizona$106$1,269
Michigan$106$1,271
Minnesota$106$1,273
Ohio$106$1,273
North Carolina$109$1,305
Oregon$109$1,308
Pennsylvania$109$1,305
Georgia$111$1,334
Colorado$113$1,354
Florida$113$1,356
Texas$113$1,354
Delaware$116$1,390
Nevada$116$1,392
Virginia$116$1,394
Washington$116$1,390
Connecticut$119$1,427
Illinois$119$1,427
Maryland$119$1,427
Massachusetts$120$1,431
New Jersey$121$1,450
California$123$1,479
New York$127$1,515
District of Columbia$129$1,547

Factors Affecting Restaurant Business Insurance Costs

Full-service restaurants carry a distinct insurance profile because customers sit, stay and interact with staff across an entire meal, generating liability, staffing and operational exposure that other food business formats don't produce at the same scale. Understanding which of these factors apply to your operation is one of the more practical ways to make sense of restaurant business insurance costs.

    wine icon
    Alcohol service

    If your restaurant serves alcohol, expect liquor liability exposure to push your premiums up. The extent of your bar program matters: running a full bar with late-night service carries more exposure than a limited wine and beer menu, and dram shop laws in your state may affect how insurers price that risk.

    smallBusiness icon
    Seating capacity and customer volume

    The more customers your dining room turns across two services on a weekend night, the more customer-facing interactions your operation generates. Higher foot traffic through your dining room and restrooms raises your slip-and-fall and bodily injury exposure, which insurers weigh directly when pricing your liability coverage.

    oven icon
    Kitchen and equipment profile

    Your kitchen's cooking volume and equipment load matter to insurers in ways your floor plan alone doesn't capture. Running high-volume cooking lines, walk-in coolers and hood systems through continuous lunch and dinner services represents substantial asset value and ongoing fire risk, both of which feed into your property and liability pricing.

    smallCalculator icon
    Payroll structure and staffing model

    Total payroll is the basis for your workers' comp premium, so how you staff your restaurant matters as much as how many people you employ. Tipped server wages, kitchen overtime and part-time staff added for holiday seatings and private dining events all push your payroll base up, and your premium moves with it.

    foodDelivery icon
    Delivery and vehicle operations

    Running your own delivery or operating vehicles for off-site catering rather than using third-party platforms adds a coverage layer that doesn't come standard in your restaurant policy. What you pay for commercial auto depends on your vehicle count, your drivers' records and how far they travel per shift.

How to Lower Restaurant Business Insurance Costs

Restaurant insurance costs are shaped by more variables than most small businesses carry, which means there's more room to influence what you pay. Some adjustments take effect when you next shop or renew, while others require operational changes that build over time.

The five methods below cover both and can help you find more affordable coverage for your restaurant.

    vsDocuments icon
    Compare quotes using the same coverage limits

    Restaurant insurance covers multiple policy types, and rates for the same coverage can vary by hundreds of dollars annually across insurers. To compare accurately, request quotes using identical limits across all policies: the same general liability limits, the same property coverage amount, the same workers' comp class codes. Mixing limit structures makes quotes incomparable and can point you toward the wrong provider for your operation.

    uninsured icon
    Right-size your coverage

    Full-service restaurants often carry coverage limits set at policy inception and never revisited. If your dining room has shrunk, your delivery program ended or your payroll has changed, your current limits may no longer reflect your actual exposure. Review each coverage type annually against your current operation, not the one you had when you first bought the policy.

    money2 icon
    Increase your deductible strategically

    Raising your deductible on commercial property coverage can reduce your premium if your restaurant generates consistent revenue across predictable service cycles. If your restaurant runs steady dinner covers, you're a better candidate for a higher property deductible than one managing volatile seasonal swings, and you can likely absorb a mid-range claim without disrupting cash flow.

    shoppingBag icon
    Bundle policies with the same provider

    As a full-service restaurant, you're likely carrying several policies at once: general liability, workers' comp, commercial property and sometimes commercial auto. Placing them with the same insurer often produces a multi-policy discount and simplifies renewal, claims and certificate management, a practical advantage when your operation depends on proof of coverage for vendor contracts and lease agreements.

    stackOfBooks icon
    Invest in risk management practices

    The claims that drive restaurant premiums up over time, including slip-and-fall injuries in the dining room, kitchen fires and alcohol-related incidents, are also the ones most responsive to documented prevention programs. Insurers rate your risk based on your exposure profile, and a consistent record of loss prevention lowers that profile across multiple coverage lines over time.

    • Train front-of-house staff on spill response and floor hazard protocols during pre-shift meetings to reduce how often floor hazards become claims.
    • Implement a documented kitchen fire prevention schedule covering hood cleaning, fryer maintenance and suppression system inspections tied to service volume.
    • Require TIPS or ServSafe alcohol certification for all bar and floor staff who serve or handle alcohol to reduce your dram shop exposure.
    • Document walk-in cooler and prep station temperatures on a consistent log; compliance records reduce spoilage and contamination claims over time.

Restaurant Business Insurance Cost: Bottom Line

The sub-industry average of $124 monthly is an estimate across five coverage types, not a prediction of what your restaurant will pay. Your rate depends on factors specific to your dining room operation: your staffing model, whether you run a bar program and the vehicles your kitchen and events team use. These questions help put any quote you receive in context:

  1. Where do you fall in the distribution? Start by locating your restaurant within the benchmarks on this page. A full-service restaurant with no liquor license and no delivery sits closer to the low end; one running a full bar and catering vehicles prices higher. Liquor liability laws vary by state and affect where your profile lands.
  2. Is your quote consistent with your risk profile? A quote sitting well above or below the benchmark for your restaurant's profile is worth examining before you accept it. Check which coverage types are driving the gap: your general liability limit, workers' comp classification or property valuation. Then confirm whether those figures reflect how your restaurant actually operates.
  3. Which cost drivers apply to your business? Not every cost driver applies equally to your operation. A neighborhood BYO and a full-service bar program represent meaningfully different risk profiles within the same industry. Identify which factors actually shape your exposure before treating the $124 average as your starting point.

The gap between a benchmark and a real quote usually comes down to a small number of operation-specific variables. These estimates are most useful as a range to locate yourself within, not a fixed target.

Restaurant Business Insurance Cost: Next Steps

If you're still working out whether a specific coverage type applies to your restaurant, that question is worth resolving before cost becomes the focus. Coverage requirements for full-service restaurants vary by whether you serve alcohol, operate a commercial kitchen or face particular demands from your landlord. What you need to cover shapes how much you'll pay, and the amount of coverage that makes sense follows naturally once applicability is clear.

If you're ready to move forward and want to find the best value for your operation, the next step is comparing providers. Now that you have a sense of what full-service restaurants pay, comparing provider pricing against your operation's profile is where benchmarks become actionable.

If your quote comes in much higher or lower than the benchmarks on this page

If your restaurant is seasonal or runs reduced hours part of the year

If you're opening a new restaurant and don't have a claims history yet

If you're deciding whether to buy each policy separately or bundle with one insurer

About Connor Bolton


Connor Bolton headshot

Connor Bolton is Senior SEO and Content Manager at MoneyGeek, where he leads the business and pet insurance editorial teams. As editorial lead for both verticals, Connor sets the research framework, data standards, and content structure that his writers execute, directly authoring in-depth guides himself and reviewing all team content for accuracy and practical value before it goes live. With over four years evaluating insurance products across personal, commercial, and specialty lines, he brings cross-vertical knowledge to every guide the team produces.

Connor architected MoneyGeek's insurance research infrastructure across all major verticals including auto, home, renters, life, health, business, and pet, building systems for pricing analysis, provider-level research, customer experience evaluation, and coverage analysis with AI support. The infrastructure includes over 6 million data points for business insurance across 408 industry areas, all 50 states, and 16 vehicle types, and over 5 million pet insurance profiles across 18 major providers and hundreds of breed and age combinations. Connor's insurance cost research and his team's work has been cited by the U.S. Chamber of Commerce, Allstate, Liberty Mutual, CBS News, Forbes and LegalZoom.

Beyond the data, Connor stays connected to how the market actually operates, drawing on direct conversations with underwriters and carrier liaisons at Ethos, The Hartford, NEXT Insurance, Nationwide, and State Farm, and monitoring business and pet owner communities including Reddit, to inform how he interprets findings and frames guidance for real buyers.

He is the direct editorial contact for methodology questions at connor@moneygeek.com and can be found on LinkedIn.