Most US Home Insurance Policies Cover Only 70% of What a Rebuild Would Cost. The Shortfall Has Widened for a Decade.

Updated: April 20, 2026

Advertising & Editorial Disclosure

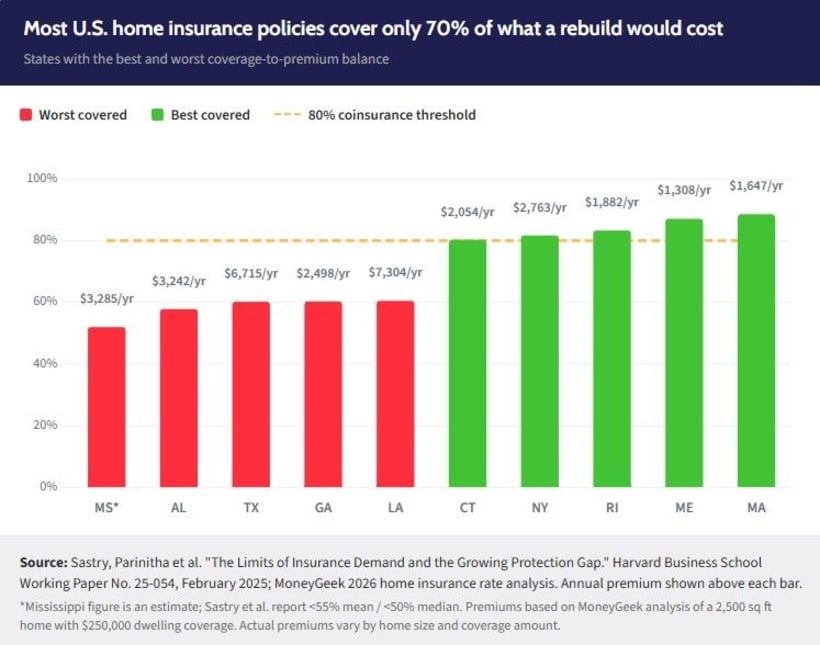
The average U.S. homeowner with a mortgage insures only 70% of what it would cost to rebuild their home. That's the finding of a Harvard Business School working paper that, for the first time, links about 100 million individual mortgage records to insurance policy data. And 70% understates the current problem: the researchers found average coverage ratios fell from 70% in 2011 to about 50% by 2020. The shortfall between what policies pay and what rebuilds cost has widened steadily for more than a decade.

The Marshall Fire put that math into real numbers. It destroyed more than 1,000 homes in Boulder County, Colorado, in December 2021. A Federal Reserve Bank of Philadelphia working paper analyzed contract-level data from about 5,000 Marshall Fire claims and found that 74% of affected homeowners were underinsured. In 36% of cases, coverage fell below 75% of replacement cost. The researchers classified those homeowners as severely underinsured. Colorado's Division of Insurance found that only 8% of homeowners carried guaranteed replacement coverage.

Bar chart showing: Most U.S. Home Insurance Policies Cover Only 70% of What a Rebuild Would Cost

What the Research Found

The study, "The Limits of Insurance Demand and the Growing Protection Gap," was led by Parinitha Sastry with co-authors from Harvard Business School, Columbia Business School and the Federal Reserve. The researchers linked about 100 million mortgage records to insurance policy data and calculated the share of estimated rebuild costs homeowners carry in coverage. They presented the findings at the 2024 Duke Corporate Finance Conference.

Homeowners in Alabama and Mississippi carry close to or below 55% of their rebuild costs in coverage. Louisiana homeowners cover only 58% to 61%. A total loss in any of those states leaves the household responsible for a large share of the reconstruction bill, covered by savings, debt or federal disaster aid. Underinsurance isn't limited to high-risk coastal states. Coverage shortfalls show up in any market where home values and construction costs have risen faster than policyholders have updated their coverage limits.

Why Coverage Falls Short

Underinsurance rarely starts as a deliberate choice. It accumulates through choices most homeowners never think about.

Most policies are set at purchase and never adjusted for inflation. Coverage A limits, which set the maximum payout for a total loss, don't automatically adjust as construction costs rise. The Turner Building Cost Index, which measures nationwide nonresidential construction labor and materials costs, rose 8% in 2022 and 6% in 2023 during the post-pandemic surge, then climbed another 3.9% in 2024 and 4.1% in 2025 to a record high. Homeowners who haven't revisited their Coverage A limit in several years carry limits based on a construction market that no longer exists.

Market value and replacement cost are different numbers. Market value includes the land, which can't burn. Replacement cost is the price to rebuild the structure at current labor and materials costs. In high-cost markets like California or Colorado, that figure can run much higher than the sale price.

Premium increases push coverage down, not up. The Sastry research found that every 1% increase in insurance prices cuts coverage by 0.3% to 0.8%. When premiums rise, homeowners trying to keep total housing costs manageable accept lower coverage limits. Higher premiums can erode coverage from the inside.

Lenders require insurance at the loan balance, not at replacement cost. A homeowner who has paid down their mortgage may carry a policy that protects the lender's interest but not the full cost to rebuild.

The States Where High Premiums Buy the Least Coverage

MoneyGeek combined Sastry et al.'s state-level coverage ratios with its own 2026 premium data to produce a comparison that hasn't appeared elsewhere. The results undermine a common assumption: that homeowners paying the most for insurance are buying the most financial protection.

Louisiana homeowners pay $7,304 a year on average and cover only 58% of rebuild costs at the median. In Massachusetts, the premium drops to $1,647 and coverage climbs to 84%. The Louisiana rate is 4.4 times the Massachusetts rate, and Louisiana's coverage ratio runs 26 percentage points lower. Texas policyholders pay $6,715 and cover 59%. Georgia homeowners pay $2,498, close to Connecticut's $2,054, but their coverage ratio runs 19 percentage points lower.

The pattern runs counter to what you'd expect. Higher premiums don't mean better coverage. They mean higher risk. The worst-covered states aren't paying less to take on that gap. Most are paying more.

Mississippi
<55%
~52% (est.)
$3,285
~50%+
Alabama
57.8%
55.2%
$3,242
44.8%
Texas
60.2%
58.9%
$6,715
41.1%
Georgia
60.3%
57.8%
$2,498
42.2%
Louisiana
60.5%
58.1%
$7,304
41.9%
Connecticut
80.3%
76.6%
$2,054
23.4%
New York
81.7%
75.7%
$2,763
24.3%
Rhode Island
83.3%
80.8%
$1,882
19.2%
Maine
87.1%
80.5%
$1,308
19.5%
Massachusetts
88.6%
84.3%
$1,647
15.7%
mglogo icon

Sources: Sastry et al. (2025), Harvard Business School Working Paper No. 25-054; MoneyGeek 2026 home insurance rate analysis. Mississippi figure is an estimate; Sastry et al. report <55% mean / <50% median. Premiums based on MoneyGeek's analysis of a 2,500-sq-ft home with $250,000 dwelling coverage; premiums vary by home size and coverage amount.

The Equity Problem: Credit Scores, Premiums and Coverage

Underinsurance falls hardest on the homeowners least able to absorb it.

A 2026 NBER working paper by Blonz, Keys, Mulder and co-authors analyzed 70 million insurance policies linked to mortgage data and found that homeowners with low credit scores pay 24% more for identical coverage than high-credit homeowners. The national difference averages about $550 a year. In some states, low-credit homeowners spend over 40% of their mortgage costs on insurance alone.

The Sastry research found a direct relationship between credit scores and coverage ratios. Homeowners with lower credit scores pay the most and carry the least coverage. Those with scores above 780 average 70% to 85% coverage.

In California, a March 2026 report from UC Berkeley's Terner Center found that 40% of mobile home owners without a mortgage, about 98,000 households, were entirely uninsured in 2023. Uninsured rates for condo owners were 31%. Low-income California homeowners earning under $66,000 a year spent 3% of household income on home insurance in 2023, compared with about 1% for median earners in the state.

The Default Risk

The financial consequences of underinsurance extend past the repair bill. The Marshall Fire data shows how.

Sastry and co-authors tracked borrowers after Hurricanes Harvey and Irma in 2017 and found that underinsured borrowers defaulted on their mortgages 38 basis points more often than fully insured borrowers. The higher default rates continued into the following year.

The Philadelphia Fed's Marshall Fire analysis also tracks displacement. Every 10 percentage-point increase in underinsurance reduced the share of homeowners filing a rebuilding permit within a year by four points. Underinsurance lowered total rebuilding permits filed within a year by 25% and accounted for more than half of all property sales of destroyed homes within 18 months of the fire. For many households, the shortfall ended homeownership.

The 80% Rule Most Policyholders Don't Know About

Most standard homeowners policies include a coinsurance clause, often called the 80% rule, that requires policyholders to insure their home for at least 80% of its full replacement value to receive full claim payments on partial losses.

If a home costs $500,000 to rebuild and the homeowner carries $300,000 in dwelling coverage (60% of replacement value), partial claim payments drop proportionally. A $100,000 kitchen fire claim might pay out $75,000, not because of the deductible, but because the policy fell below the 80% threshold and the coinsurance formula applied. Most homeowners who trigger this provision didn't know it was in their policy.

Calculating the Coverage Ratio

Two numbers are needed to calculate a coverage ratio: the Coverage A (dwelling coverage) limit from the policy declarations page and an estimate of replacement cost. Replacement cost is calculated by multiplying square footage by local per-square-foot construction costs. Regional data from CoreLogic's Marshall & Swift database, the industry standard for insurer dwelling valuations, shows wide variation by market. Insurers and agents can run precise replacement cost calculations using that tool. Dividing the Coverage A limit by the replacement cost estimate gives the coverage ratio.

A ratio below 0.8 puts the policyholder below the threshold where most standard policies apply the coinsurance penalty. A ratio below 1.0 means any total loss leaves a shortfall.

Two endorsements can address that shortfall, where they're available: extended replacement cost coverage, which adds 25% to 50% above the stated limit, and guaranteed replacement cost coverage, which pays whatever the rebuild costs with no cap.

MoneyGeek's home insurance calculator measures coverage against current replacement cost estimates by state and home size. Extended and guaranteed replacement cost endorsements are available from most major insurers.

About Nathan Paulus


Nathan Paulus headshot

Nathan Paulus is the Head of Content at MoneyGeek, where he conducts original data analysis and oversees editorial strategy for insurance and personal finance coverage. He has published hundreds of data-driven studies analyzing insurance markets, consumer costs and coverage trends over the past decade. His research combines statistical analysis with accessible financial guidance for millions of readers annually.

Paulus earned his B.A. in English from the University of St. Thomas, Houston.


sources