
MoneyGeek analyzed 2,976 fatal motor vehicle accidents across 1,812 Illinois roads from 2018 to 2020, out of the state's 306,658 road miles. The study spans driver behavior, seasonal crash patterns and county-level road rankings.
Illinois Fatal Accident Study:
Illinois’ Deadliest Roads and Fatal Accident Statistics
Updated: July 31, 2026
Advertising & Editorial Disclosure

Key Findings
- Ashland Ave. from W. 74th St. to W. 47th St. in Chicago is Illinois' deadliest stretch of road. Between 2018 and 2020, nine fatal accidents occurred on that stretch.
- Speeding appeared in 38.9% of Illinois fatal crashes from 2018 to 2020 (1,159 of 2,976), more than any other contributing factor. Drunk driving ranked second at 26.5%.
- Distracted driving appeared in 12.2% of fatal accidents, the lowest rate among the three behaviors measured. MoneyGeek's distracted driving study ranked Illinois eighth-worst in the U.S.
- From 2018 to 2020, July had the most fatal accidents of any month at 312. August followed with 296 fatal crashes. September recorded 291. Illinois ranked 10th nationally for winter driving fatalities; its three deadliest months all fell in summer and early fall.
- Cook County had the most fatal accidents in Illinois. Most crashes there occurred on I-57.
10 Deadliest Road Stretches in Illinois
- 1. Ashland Ave. from W. 74th St. to W. 47th St.Cities:Chicago
 Chicago
- 9Fatal Accidents
- 9fatalities
- 3Crashes Per Mile
- 3.5 milesdistance
- (41.75784444, -87.66360556)start
- (41.80860833, -87.66497222)end
- [ 2 3 4 5 6 7 8 9 11]points
- 23ordering
- {'Chicago'}localities
- {'Cook'}counties
- TRUEintersect
- Ashland AveTWAY_ID
- 2. I-57 from Exit 353 to Exit 348Cities:Blue Island | Riverdale | Markham | Posen
 Blue Island | Riverdale | Markham | Posen
- 8Fatal Accidents
- 9fatalities
- 2Crashes Per Mile
- 4.2 milesdistance
- (41.65417222, -87.66148611)start
- (41.60353611, -87.706875)end
- [16 21 28 29 35 38 39 47]points
- 15ordering
- {'Blue Island', 'Riverdale', 'Markham', 'Posen'}localities
- {'Cook'}counties
- TRUEintersect
- I-57TWAY_ID
- 3. Lake St. from N. Cicero Ave. to N. Sacramento Blvd.Cities:Chicago
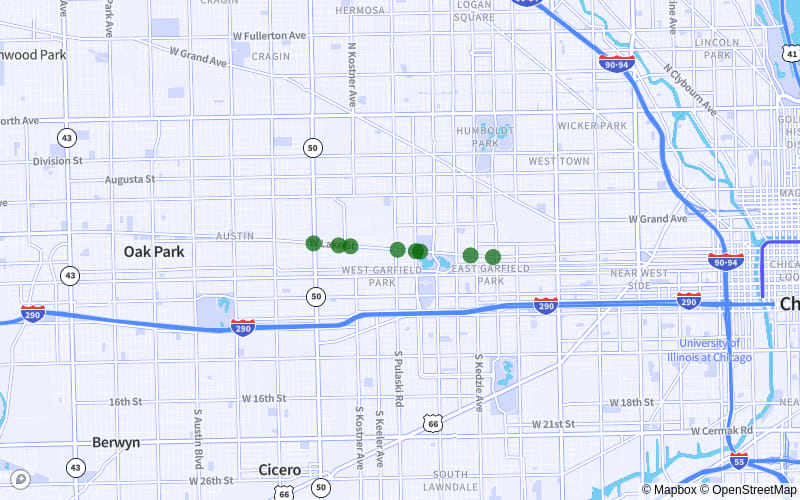 Chicago
- 8Fatal Accidents
- 9fatalities
- 4Crashes Per Mile
- 2.3 milesdistance
- (41.88661111, -87.74575833)start
- (41.88413611, -87.70218056)end
- [1 2 4 5 6 7 8 9]points
- 28ordering
- {'Chicago'}localities
- {'Cook'}counties
- TRUEintersect
- Lake StTWAY_ID
- 4. SR-43 Harlem Ave. from W. 34th St. to W. 63rd St.Cities:Summit | Chicago | Berwyn
 Summit | Chicago | Berwyn
- 8Fatal Accidents
- 8fatalities
- 2Crashes Per Mile
- 3.7 milesdistance
- (41.829925, -87.80288889)start
- (41.77676389, -87.80090556)end
- [ 0 1 3 4 5 6 11 12]points
- 17ordering
- {'Summit', 'Chicago', 'Berwyn'}localities
- {'Cook'}counties
- TRUEintersect
- SR-43 Harlem AveTWAY_ID
- 5. I-55 from Exit 287 to 292BCities:Chicago
 Chicago
- 7Fatal Accidents
- 8fatalities
- 2Crashes Per Mile
- 4.3 milesdistance
- (41.82275833, -87.72480278)start
- (41.84572778, -87.64664167)end
- [20 26 27 34 38 42 46]points
- 11ordering
- {'Chicago'}localities
- {'Cook'}counties
- TRUEintersect
- I-55TWAY_ID
- 6. I-290 from Exit 15A to Exit 21BCities:Forest Park | Maywood | Chicago
 Forest Park | Maywood | Chicago
- 7Fatal Accidents
- 8fatalities
- 1Crashes Per Mile
- 4.9 milesdistance
- (41.87368056, -87.90235278)start
- (41.87382222, -87.80789444)end
- [ 4 5 7 8 9 10 13]points
- 10ordering
- {'Not Applicable', 'Forest Park', 'Maywood', 'Chicago'}localities
- {'Cook'}counties
- TRUEintersect
- I-290TWAY_ID
- 7. SR-111 from Chain of Rocks Rd. to Broadway Ave.Cities:South Roxana | Pontoon Beach
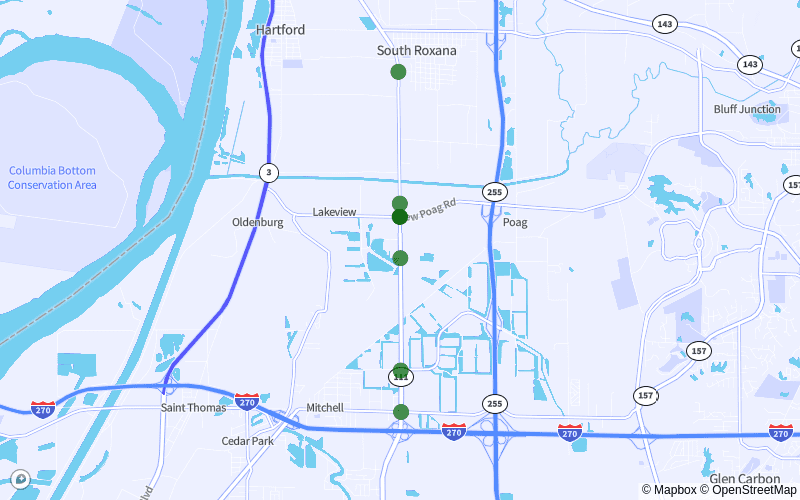 South Roxana | Pontoon Beach
- 7Fatal Accidents
- 8fatalities
- 2Crashes Per Mile
- 4.4 milesdistance
- (38.76115278, -90.06666944)start
- (38.82551944, -90.067325)end
- [ 0 1 3 6 7 8 10]points
- 11ordering
- {'Not Applicable', 'South Roxana', 'Pontoon Beach'}localities
- {'Madison'}counties
- TRUEintersect
- SR-111TWAY_ID
- 8. I-80 from Exit 134 to Exit 127Cities:Joliet
 Joliet
- 7Fatal Accidents
- 7fatalities
- 1Crashes Per Mile
- 4.9 milesdistance
- (41.51299722, -88.06036667)start
- (41.50253056, -88.15431389)end
- [ 2 14 16 26 35 37 47]points
- 10ordering
- {'Not Applicable', 'Unknown', 'Joliet'}localities
- {'Will'}counties
- TRUEintersect
- I-80TWAY_ID
- 9. I-94 from Exit 56B to Exit 62Cities:Chicago
 Chicago
- 7Fatal Accidents
- 7fatalities
- 2Crashes Per Mile
- 4.7 milesdistance
- (41.794975, -87.63078889)start
- (41.72693056, -87.624775)end
- [ 4 5 10 13 14 15 16]points
- 10ordering
- {'Not Applicable', 'Chicago'}localities
- {'Cook'}counties
- TRUEintersect
- I-94TWAY_ID
- 10. 87th St. from S. Lafayette Ave. to S. Pulaski Rd.Cities:Chicago | Evergreen Park
 Chicago | Evergreen Park
- 7Fatal Accidents
- 7fatalities
- 1Crashes Per Mile
- 5.0 milesdistance
- (41.73631667, -87.62511667)start
- (41.73483333, -87.72141667)end
- [1 3 4 5 6 7 8]points
- 10ordering
- {'Not Applicable', 'Chicago', 'Evergreen Park'}localities
- {'Cook'}counties
- TRUEintersect
- 87Th StTWAY_ID
Drunk Driving Involved in 26.5% of Fatal Accidents
Drunk driving was a factor in 26.5% of Illinois' 2,976 fatal crashes from 2018 to 2020, second only to speeding.
Illinois sets the legal intoxication threshold at 0.08% blood alcohol concentration (BAC). Impairment can begin as low as 0.02%, roughly two drinks. At that level, reaction time slows. Object tracking also deteriorates.
A DUI conviction in Illinois brings restricted driving privileges, fines and jail time. Convicted drivers must also carry SR-22 car insurance, which costs more than a standard policy.
Speeding Is a Factor in 38.9% of Fatal Crashes
Speeding appeared in 38.9% of fatal accidents in Illinois from 2018 to 2020 (1,159 of 2,976), the highest rate of any contributing factor.
Higher speeds extend stopping distances. When crashes occur, greater impact force reduces the effectiveness of airbags and seatbelts.
Distracted Driving Contributed to 12.2% of Fatal Accidents
Distracted driving contributed to 12.2% of fatal crashes in Illinois from 2018 to 2020, or 362 deaths. Despite a state ban on mobile phones and electronic devices while driving, MoneyGeek’s distracted driving study ranked Illinois eighth-worst in the U.S.
July Had More Fatal Accidents Than Any Other Month
July was Illinois' deadliest month from 2018 to 2020, with 312 fatal accidents, or 10.5% of all fatal crashes in the period.
The month falls within the 100 Deadliest Days of Summer, the stretch between Memorial Day and Labor Day when crash rates climb. Teen drivers see the biggest increases. August followed with 296 fatal crashes. September recorded 291.
Illinois ranked 10th nationally for winter driving fatalities in MoneyGeek's winter driving study. Summer and early fall still produced the highest crash counts.
Illinois Car Insurance Rates
Full coverage car insurance in Illinois averages $1,134 a year. Rates vary by city: Aurora drivers pay around $837 a year, $297 below the state figure. Chicago drivers pay the state average.
Insurers set premiums based on driver age, driving history and vehicle type. MoneyGeek's cheapest car insurance rankings compare costs across major providers for the same driver profile.
Fatal Accidents and Most Dangerous Roads: County Breakdown
The five most affected Illinois counties account for 46% of all recorded fatal crashes from 2018 to 2020, or 1,369 deaths. Cook County led with 869 crashes, most of them on I-57. Speeding and distracted driving were the top contributing factors.
Methodology
MoneyGeek analyzed data from the National Highway Traffic Safety Administration's Fatality Analysis Reporting System (FARS) for 2018, 2019 and 2020, the most recent years available at the time of the study.
About Doug Milnes, CFA

Doug Milnes is a CFA charter holder with over 10 years of experience in corporate finance. He led the Credit Cards vertical at MoneyGeek. At Duff and Phelps, he performed valuations. He later conducted financial planning and analysis at several other companies. His analysis has been cited by U.S. News & World Report, The Hill, the Los Angeles Times, the New York Times and many other outlets.
Doug holds a master's degree in data science from Northwestern University. He writes about credit card strategy, including debt management and rewards.
Sources
- National Highway Traffic Safety Administration. "Fatality Analysis Reporting System (FARS)." Accessed August 3, 2026.
- National Highway Traffic Safety Administration. "Speeding." Accessed August 3, 2026.
- Office of the Illinois Secretary of State. "Distracted, Drowsy and Aggressive Driving." Accessed August 3, 2026.
- We Save Lives. "100 Deadliest Days of Summer." Accessed August 3, 2026.