Americans Are Living Longer and Outlasting Their Life Insurance

Updated: April 17, 2026

Advertising & Editorial Disclosure

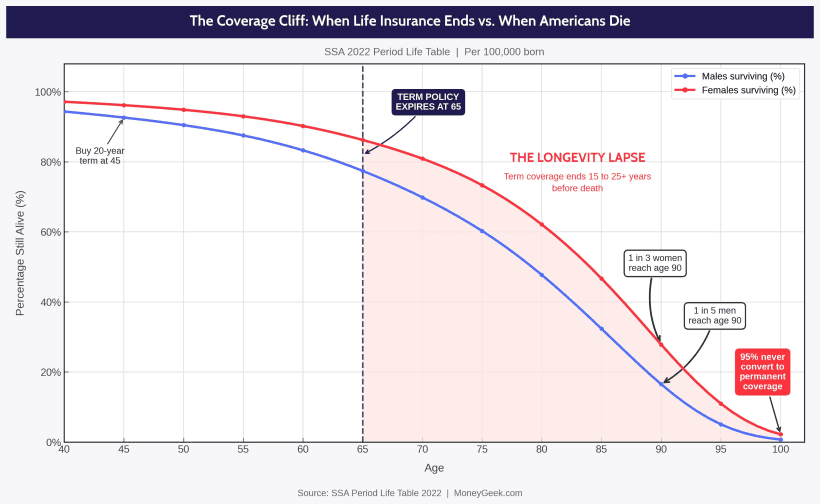
Roughly 4 million Americans turn 65 each year. One in five of the men and one in three of the women will live to 90, all of those years without life insurance, because the 20-year term life insurance policy they bought at 45 ran out the day they retired. That's more than 1 million people from this year's cohort alone who will spend up to 25 years uninsured during the period when health costs are highest.

MoneyGeek defines this as the "longevity lapse": the years between when a term policy expires and when the policyholder dies. For the average 65-year-old man it runs 17.5 years. For the average 65-year-old woman, 20.1 years. And for the roughly one in three women who reach 90, it runs a full quarter-century.

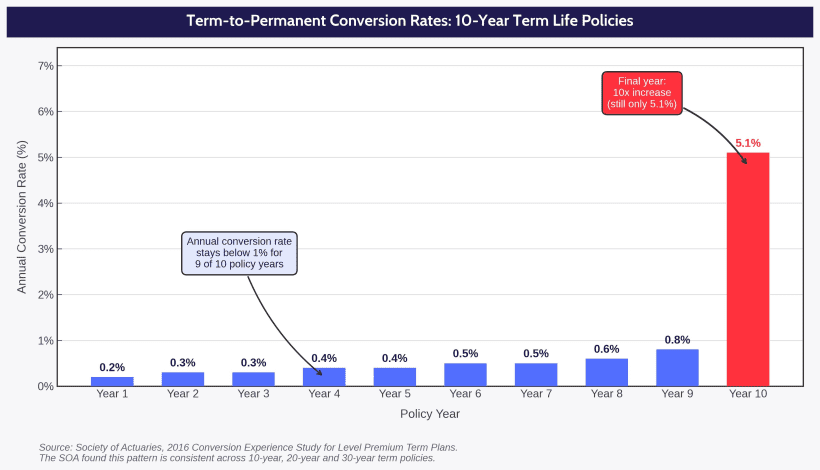
About 95% of term life insurance policyholders never convert to a permanent policy. With annual conversion rates below 1% for most of a policy's life and only about 5% converting even in the final year, the vast majority of term holders let their coverage end without a backup plan. Data from the Social Security Administration's (SSA) actuarial life tables, the same mortality data the federal government uses to calculate Social Security benefits, shows they're living far longer than the products they purchased were built to cover.

mglogo icon
KEY FINDINGS
  • About 95% of term life policyholders never convert to permanent coverage. Conversion rates stay below 1% annually for most of a policy's life, increasing to just 5.1% in the final year, which leaves the majority without permanent coverage.
  • A 65-year-old male has 17.5 years of remaining life expectancy on average; a 65-year-old female has about 20 years. Most policyholders who bought 20-year term policies in their 40s will outlive their coverage by 15 to 25 years.
  • Women are about 51% more likely than men to survive from 65 to 90 (about one in three women vs. one in five men), yet only 48% of women own any life insurance compared to 54% of men.
  • Total U.S. life insurance in force reached a record $22.2 trillion in 2023, yet 40% of American adults (about 100 million people) say they need more coverage.

The Longevity Lapse: What It Is and Why It's Growing

MoneyGeek defines the "longevity lapse" as the period between when a life insurance policy expires and when the policyholder dies. For a 45-year-old who buys a 20-year term policy, coverage ends at 65. The SSA's 2022 Period Life Table shows a 65-year-old male has an average of 17.48 years of life remaining, putting his life expectancy at 82.48. A 65-year-old female has 20.12 additional years, reaching an average of 85.12.

That uninsured stretch can reach 15 to 25 years or longer, and it's not limited to a small group of policyholders. About 90 million American families depend on life insurance products for financial security, and the ACLI Life Insurers Fact Book puts total life insurance in force at a record $22.2 trillion in 2023. The 20-year term is the most popular policy length, per LIMRA.

Average life expectancy at birth in the U.S. was 77.5 years in 2022, per the CDC. But life expectancy at 65 is much higher: 82.48 for men and 85.12 for women, because it excludes everyone who died before reaching 65. A 20-year term policy purchased at 45 covers roughly half the years between purchase and death for the average 65-year-old, and none of the years after 65, when health risks and end-of-life costs are highest.

One in Five Men and One in Three Women Who Reach 65 Will Live to 90

The averages understate how long many Americans live. SSA data shows that of every 100,000 males born, 77,402 survive to age 65. Of those, 16,504 will reach age 90, a 21.3% survival rate. Women live even longer: 27,827 out of 86,231 females who reach 65 will survive to 90, a 32.3% probability.

Put another way, roughly one in five men and one in three women who reach 65 will live another 25 years. A 45-year-old man who buys a 20-year term policy today will, if he reaches 65, have a one-in-five chance of living to 90, all 25 of those years without life insurance coverage.

Of those who reach 65, SSA data shows 54.1% of women and 41.8% of men will still be alive at 85. These are observed figures from the 2022 Period Life Table, not projections or estimates. The federal government uses the same actuarial tables to calculate Social Security benefits.

SSA actuarial data shows that most Americans who buy a 20-year term life policy at age 45 and reach 65 will outlive their coverage by 15 to 25 years. The survival curves below, drawn from the SSA's 2022 Period Life Table, show the percentage of Americans still alive at each age from 65 onward. The shaded area represents the longevity lapse: the years when mortality risk is highest but term coverage has ended.

Line chart showing survival rates for U.S. males and females from age 40 to 100, per 100,000 born, based on SSA 2022 Period Life Table data. A dashed vertical line at age 65 marks when a 20-year term policy purchased at 45 expires.

States Where the Longevity Lapse Is Longest

The longevity lapse varies by state. CDC data from the 2021 U.S. State Life Tables (NVSR Volume 73, Number 7) shows a 9.0-year spread in life expectancy at birth across states, from Hawaii's 79.9 years to Mississippi's 70.9 years. These birth-based figures represent a floor for the lapse: because conditional life expectancy at 65 is always higher than life expectancy at birth, residents in every state who reach 65 will outlive their coverage by more years than the birth figures suggest.

Hawaii leads the nation at 79.9 years (77.0 for males, 83.1 for females). Massachusetts ranks second at 79.6, followed by Connecticut at 79.2, New Jersey and New York at 79.0 and Minnesota at 78.8. Based on birth-based figures alone, a 45-year-old in Hawaii who buys a 20-year term policy can expect to outlive it by about 15 years at minimum. For those who survive to retirement, the nationally observed conditional life expectancy at 65 puts the actual lapse closer to 17 to 20 years.

At the other end, Mississippi has the lowest life expectancy at 70.9 years, followed by West Virginia at 71.0 and Alabama at 72.0. Even in these states, a 65-year-old who has already survived to that age has a remaining life expectancy above 17 years for men and above 19 years for women. The longevity lapse is a national problem, not a coastal one.

1
Hawaii
79.9
77.0
83.1
14.9 yrs
2
Massachusetts
79.6
76.9
82.2
14.6 yrs
3
Connecticut
79.2
76.3
82.0
14.2 yrs
4
New Jersey
79.0
76.3
81.6
14.0 yrs
5
New York
79.0
76.3
81.6
14.0 yrs
6
Minnesota
78.8
76.3
81.4
13.8 yrs
7
New Hampshire
78.5
76.1
81.1
13.5 yrs
8
Rhode Island
78.5
75.9
81.0
13.5 yrs
9
Vermont
78.4
75.7
81.2
13.4 yrs
10
California
78.3
75.3
81.4
13.3 yrs
11
Utah
78.2
76.3
80.2
13.2 yrs
12
Washington
78.2
75.8
80.8
13.2 yrs
13
Nebraska
77.8
75.4
80.3
12.8 yrs
14
Wisconsin
77.8
75.2
80.5
12.8 yrs
15
Colorado
77.7
75.0
80.6
12.7 yrs
16
Iowa
77.7
75.2
80.4
12.7 yrs
17
North Dakota
77.6
75.0
80.5
12.6 yrs
18
Oregon
77.4
74.8
80.2
12.4 yrs
19
Idaho
77.2
74.8
79.7
12.2 yrs
20
Maryland
77.2
74.3
79.9
12.2 yrs
21
Illinois
77.1
74.2
80.0
12.1 yrs
22
Virginia
76.8
74.2
79.4
11.8 yrs
23
Maine
76.7
73.8
79.8
11.7 yrs
24
South Dakota
76.6
74.1
79.3
11.6 yrs
25
Pennsylvania
76.4
73.6
79.3
11.4 yrs
26
Delaware
76.3
73.3
79.4
11.3 yrs
27
Florida
76.1
73.1
79.3
11.1 yrs
28
Kansas
76.0
73.4
78.7
11.0 yrs
29
Montana
75.8
73.1
78.8
10.8 yrs
30
Michigan
75.7
72.9
78.6
10.7 yrs
31
Texas
75.4
72.7
78.3
10.4 yrs
32
District of Columbia
75.3
71.9
78.5
10.3 yrs
33
Nevada
75.1
72.4
78.2
10.1 yrs
34
Arizona
75.0
72.0
78.3
10.0 yrs
35
Wyoming
75.0
72.5
77.7
10.0 yrs
36
North Carolina
74.9
72.0
77.9
9.9 yrs
37
Indiana
74.6
71.8
77.5
9.6 yrs
38
Missouri
74.6
71.6
77.8
9.6 yrs
39
Alaska
74.5
72.2
77.3
9.5 yrs
40
Ohio
74.5
71.7
77.5
9.5 yrs
41
Georgia
74.3
71.6
77.1
9.3 yrs
42
South Carolina
73.5
70.4
76.7
8.5 yrs
43
New Mexico
73.0
69.4
77.0
8.0 yrs
44
Oklahoma
72.7
70.0
75.6
7.7 yrs
45
Arkansas
72.5
69.7
75.6
7.5 yrs
46
Tennessee
72.4
69.4
75.5
7.4 yrs
47
Kentucky
72.3
69.6
75.3
7.3 yrs
48
Louisiana
72.2
68.8
75.9
7.2 yrs
49
Alabama
72.0
68.9
75.3
7.0 yrs
50
West Virginia
71.0
68.1
74.2
6.0 yrs
51
Mississippi
70.9
67.7
74.3
5.9 yrs

Source: CDC U.S. State Life Tables 2021. Birth-based floor = state life expectancy at birth minus 65. Actual lapse for those who survive to 65 is longer, because conditional life expectancy at 65 exceeds life expectancy at birth in every state.

Why 20-Year Term Life Creates a Coverage Cliff

LIMRA industry data shows that 20-year term life insurance is the most popular product length in the U.S., accounting for the largest share of term sales. It's also the product most likely to create the longevity lapse. A policy designed to expire at retirement is a policy designed to leave policyholders uninsured when mortality risk is highest.

A 40-year-old nonsmoker male in good health can buy a $500,000, 20-year term policy for about $35 per month at preferred rates. That same coverage for a 30-year term costs about $49 per month, roughly 40% more. Most buyers choose the cheapest life insurance option, expecting to reassess at renewal.

The economics change at renewal. MoneyGeek's 2026 rate analysis shows a 60-year-old nonsmoking male pays $395 per month for $500,000 in 20-year term coverage at standard rates, which is more than 11 times the $35 a 40-year-old pays for the same policy. At 65, many carriers stop issuing 20-year terms entirely. MoneyGeek's rate research found no 20-year term quotes available past age 65 from its panel of carriers, meaning reapplying for comparable coverage isn't just expensive. For many people, it's no longer available.

Over 20 years at $35 per month, a policyholder pays $8,400 in total premiums. Term life insurance provides real financial protection during those years: if the policyholder dies during the term, beneficiaries receive the full $500,000 death benefit. But if the policyholder outlives the term, the coverage ends and that protection disappears. Without a plan for what comes next, the family has no life insurance during the years when health risks are highest. This is the coverage cliff that creates the longevity lapse.

Fewer Than 1% of Policyholders Use Their Conversion Option in Any Given Year

When a term life insurance policy reaches the end of its level premium period, policyholders have three options: renew at a much higher rate, convert to a permanent policy (if the conversion privilege hasn't expired) or let the coverage lapse entirely.

The Society of Actuaries (SOA) Conversion Experience Study documents what actually happens. For 10-year term policies, the conversion rate stays below 1% annually for most of the policy life, then jumps to 5.1% in the final year — a tenfold increase. The study analyzed 166,858 conversions for 10-year terms, 158,694 for 20-year terms and 39,140 for 30-year terms across 19 participating companies. With tens of millions of individual term policies in force

Bar chart showing annual term-to-permanent life insurance conversion rates across a 10-year policy. Rates stay below 1% for years 1 through 9, then spike to 5.1% in year 10.

That final-year spike tells a story. Policyholders who convert in the last year show 55% to 95% higher post-conversion mortality rates in the first year compared to standard term mortality, per the SOA study (based on actual-to-expected mortality ratios across participating companies). SOA researchers attribute this to adverse selection: those who wait until the last moment are disproportionately policyholders whose health has declined, making them unable to qualify for new coverage at standard rates. Most healthy policyholders (those who could convert on favorable terms) never do.

Women Live Longer and Are Less Likely to Be Covered

Women experience the longest longevity lapse and are least likely to own coverage. LIMRA's 2025 Insurance Barometer Study found that 43% of women (about 52 million people) say they need life insurance or more of it, compared to 37% of men (45 million people). Yet only 48% of women own any life insurance, versus 54% of men.

SSA data compounds the problem. A 65-year-old woman has 20.12 years of remaining life expectancy versus 17.48 for a man. Women are about 51% more likely than men to survive from 65 to 90 (32.3% vs. 21.3%). Among adults over 50 approaching term expiration, this disparity means women will spend more years without coverage and are less likely to have purchased it to begin with.

Young women who delay buying have the most at risk. LIMRA's 2025 study found that adults ages 18 to 30 overestimate the cost of a $250,000, 20-year level term policy by 10 to 12 times. Less than one-quarter of Gen Z and Millennial adults say they're knowledgeable about life insurance underwriting. A woman who delays buying coverage because she believes it costs far more than it does will spend more years in the longevity lapse than anyone else in this data, longer uninsured stretch, lower ownership rate and higher longevity probability.

The Scale of the U.S. Life Insurance Market

Total U.S. life insurance in force reached a record $22.2 trillion in 2023, the fifth straight year of increases, per the ACLI Life Insurers Fact Book. But ownership has not kept pace with need. Only 51% of Americans ages 18 to 75 have any life insurance at all, and LIMRA's 2025 Insurance Barometer Study found 40% of American adults (about 100 million people) believe they need more.

Surrender activity reflects ongoing coverage attrition: total surrenders reached $484.2 billion in 2024, up from $416.2 billion the previous year. While surrenders include all product types, the figure reflects Americans exiting coverage through expiration, lapse and voluntary exit. With roughly 4 million Americans reaching 65 each year, a growing number of 20-year term policies bought in their 40s are expiring annually, and the people who bought them are aging into the longevity lapse without a plan.

How to Avoid the Longevity Lapse Before Your Policy Expires

Avoiding the longevity lapse starts with reviewing your policy at least five years before the level premium period ends. MoneyGeek's life insurance calculator can help you estimate how much coverage you'll need during and after your term. Five strategies can help close the uninsured period before your policy ends.

Review your term policy's conversion option at least two to three years before the level premium period ends. Most term policies include a conversion privilege that lets you switch to permanent coverage without a medical exam, but this option often expires before the policy itself does. The SOA study shows that fewer than 1% of policyholders use this option annually, which means many don't know it exists.

Compare the cost of converting versus buying a new policy. Conversion locks in your original health classification from when you first applied, which can save thousands over the life of a permanent policy. If your health has declined since then, the savings from converting rather than reapplying at current health status can reach 30% to 50% or more on annual premiums.

Consider laddering coverage rather than relying on a single policy. A 45-year-old can buy a 20-year term for current obligations and a smaller 30-year term for longer-term needs, such as a spouse's retirement income. The 30-year policy costs more per month but keeps coverage in place to age 75, cutting the uninsured stretch by a decade. Some insurers now offer 35-year terms for buyers in their 40s, which can push coverage past age 80.

Look into guaranteed-issue or simplified-issue life insurance if you're past 65 and can't qualify for traditional underwriting. Coverage amounts are smaller (often $10,000 to $50,000), and premiums are higher per dollar of coverage, but these products can help cover final expenses and small debts. Guaranteed universal life (GUL) insurance is a middle-path option for buyers in acceptable health who want permanent coverage without the investment component of whole life — a GUL policy guarantees a death benefit to a specific age, typically 90 or 95, at a fixed premium.

Talk to a fee-only financial planner about whether permanent life insurance, annuities or other vehicles can fill that coverage lapse. The average fee for a comprehensive financial plan ranges from $2,000 to $3,500, per the Financial Planning Association. For some families, the answer may be self-insuring through savings rather than buying a new policy. Life insurance for seniors often costs more per dollar of coverage, but even a smaller policy can reduce the uninsured period.

Methodology

MoneyGeek analyzed publicly available actuarial and industry data from six primary sources to quantify the longevity lapse between term life policy expiration and policyholder mortality.

Survival probability and life expectancy data come from the SSA's 2022 Period Life Table, published as part of the 2025 Trustees Report. State-level life expectancy data come from the CDC's U.S. State Life Tables 2021, published in National Vital Statistics Reports Volume 73, Number 7 (August 2024). Term-to-permanent conversion rates and mortality differentials come from the SOA's 2016 Report on the Conversion Experience Study for Level Premium Term Plans. Market size and sales data come from the ACLI Life Insurers Fact Book (2024 and 2025 editions) and LIMRA press releases and the 2025 Insurance Barometer Study.

All calculations in this article use published data from these sources. Premium rate data in this article reflect MoneyGeek's 2026 analysis of term life quotes from its carrier panel, updated March 19, 2026.

About Myryah Irby


Myryah Irby headshot

Myryah Irby is a writer and data journalist with a master's degree in creative writing from the University of San Francisco. She analyzes insurance, housing and personal finance data for readers making major financial decisions. Her writing and interviews have appeared in The New York Times and The San Francisco Chronicle.

Irby has managed home improvement and insurance website portfolios for more than a decade. She breaks down complex insurance and finance topics into clear, actionable guidance.


sources