Same Insurer, Different State: How Much of Your Long-Term Care Rate Hike Regulators Let Through

Advertising & Editorial Disclosure

The same long-term care policy can get its full rate increase in one state and none in another. Genworth, one of the largest long-term care insurers in the U.S., filed separate requests in at least five states to raise premiums on its Choice 2 policies. Pennsylvania approved the full 75.3% request, and Massachusetts denied a 161.6% request. Georgia allowed 15% of a 77.8% request, South Carolina allowed 20.4% of 191% and Vermont allowed 21% of 189%. Those decisions came from 2021 to 2024.

Long-term care policies pay for help with daily activities such as bathing and dressing, at home or in a facility. Medicare doesn’t cover most of that care, and premiums keep climbing for people who bought coverage years ago. How much of each increase reaches your bill, and when, can depend on the state that regulates your policy.

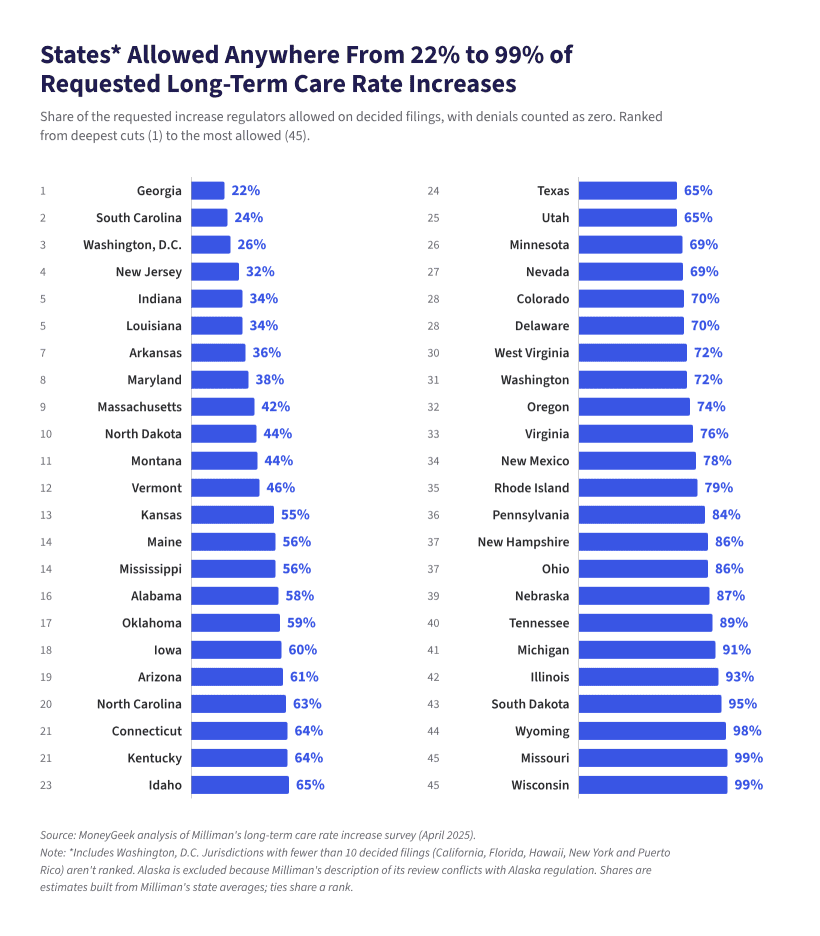
MoneyGeek’s analysis of the April 2025 Milliman long-term care rate increase survey found that Georgia regulators allowed about 22% of the increases insurers requested on decided filings, while Wisconsin and Missouri allowed 99%. The rankings compare state-level averages across filings made mostly from 2021 to 2024. They don’t track one policy block across every state.

mglogo icon
MAIN FINDINGS
  • Georgia, South Carolina and Washington, D.C., let through the smallest share of requested long-term care rate increases, about 22% to 26% of the amount insurers asked for once denials are counted.
  • Wisconsin, Missouri, Wyoming and South Dakota allowed 95% or more of the amount insurers requested on decided filings.
  • States with a flat limit on each increase allowed a median 39% of what insurers requested, compared with 67% in states with an annual cap, which phase in larger increases over several years.
  • New York had 79% of its filings in Milliman's survey still pending and only four decided, too few to judge how much it approves.
  • In 45 regulator examples MoneyGeek collected from Maine, Vermont, Virginia, Pennsylvania, Indiana and Massachusetts, regulators reduced 32 requests, denied six and approved seven in full.

How Much Are Long-Term Care Premiums Going Up?

In Milliman's April 2025 long-term care rate increase survey, the overall average request was 56%, while the average approved increase was 28%. The survey covers 17 insurers with more than 75% of the industry's premium volume. Sixteen of them reported 37 nationwide filings, which went to regulators as more than 1,000 state submissions made mostly from 2021 to 2024. Regulators approved 73% of those submissions in full or in part, and approvals took six months on average.  

Repeated rounds add up. A 2022 report from the National Association of Insurance Commissioners' (NAIC) Center for Insurance Policy and Research cites a 2021 industry data call covering more than 3,500 approved long-term care rate increases. The average single request was 78%, the average single approval was 37% and the average cumulative approved increase was 112%. Those figures cover different filings and years than Milliman's survey.

Insurers say original pricing assumptions proved too optimistic. Milliman's survey found insurers most often cited more and longer claims than expected, fewer policyholders dropping coverage and longer life spans among policyholders. Some filings MoneyGeek reviewed covered policies sold more than two decades ago, including Genworth Choice I policies in Pennsylvania issued before Sept. 16, 2002.

Which States Cut Long-Term Care Rate Increases the Most?

Georgia cut requested long-term care rate increases more than any other state in MoneyGeek's analysis. Georgia regulators approved every decided filing in Milliman's survey but held the average approved increase to 14% against an average request of 63%, which works out to about 22% of the requested amount. Georgia's public SERFF filings show the same pattern: Prudential's 88.1% request in 2021 was approved at 9.9%, and Mutual of Omaha's 49.7% request that year was approved at 15%.

Georgia regulators allowed 22% of requested long-term care rate increases, while Missouri and Wisconsin allowed 99%.
1
Georgia
22%
15%
2
South Carolina
24%
20%
3
Washington, D.C.
26%
10% (regulatory)
4
New Jersey
32%
33%, phase-in above threshold
5
Indiana
34%
25%
5
Louisiana
34%
25%
7
Arkansas
36%
25%
8
Maryland
38%
15% annual cap (regulatory)
9
Massachusetts
42%
40%, phase-in above threshold
10
North Dakota
44%
None listed

Share of requested increase allowed is MoneyGeek's denial-adjusted approval ratio, an estimate built from Milliman's state-level averages rather than a premium-dollar or policyholder-level measure. 

All eight jurisdictions with the deepest cuts are among the 24 on Milliman's list of consistent approval limits, which ranges from 10% in Washington, D.C., to 50% in Connecticut and Nebraska. Milliman built the list from insurer responses and its own judgment, and only some of the limits come from regulation. Georgia's listed limit is 15%, though its long-term care rate rule sets no percentage cap.

South Carolina's SERFF records mostly match its 20% listed limit. Of 18 South Carolina filings from 2021 to 2024 with a public approved figure, 15 were at or under 20%. Two Genworth approvals (25% and 20.4%) and one Transamerica approval (25%) went above it. Milliman notes that approvals can exceed a listed limit.

The type of limit matters. The 14 ranked jurisdictions with a flat limit on each increase allowed a median 39% of what insurers requested, and the 22 with no listed limit allowed 71%. The 10 states with an annual cap allowed a median 67%, because an increase above the cap can still be approved if it's phased in at no more than the cap each year. Policyholders in those states see more of the requested increase, spread over several years.

States with a flat limit on each increase allowed a median 39% of requested long-term care rate increases, versus 67% with annual caps.

North Dakota makes the 10 deepest-cut states for a different reason. North Dakota regulators denied 25% of the long-term care filings they decided, the highest denial rate in Milliman's survey. Approved North Dakota filings got 58% of the amount requested, and counting denials as zero brings the state's share to 44%.

Which States Approve the Most of Requested Increases?

Wisconsin and Missouri allowed 99% of the amount insurers requested on decided long-term care filings, the highest share among ranked states. Wisconsin approved 94% of its decided filings in full, and approved filings took an average of three months. Milliman says approved increases in Missouri may exceed the request through negotiation, for example to make a phased-in increase actuarially equivalent.

45
Wisconsin
99%

3

45
Missouri
99%
5
44
Wyoming
98%
2
43
South Dakota
95%
3
42
Illinois
93%
6
41
Michigan
91%
3
40
Tennessee
89%
8
39
Nebraska
87%
6
37
Ohio
86%
12
37
New Hampshire
86%
5

Ranks run from 1 (deepest cuts) to 45 across 46 ranked jurisdictions; tied jurisdictions share a rank. Source: MoneyGeek analysis of Milliman's April 2025 long-term care rate increase survey.

Illinois allowed 93% of the amount insurers requested. Its regulators said in 2013 that they had no discretion to limit increases that meet the state's rate standards, and a 15% cap the department proposed that year never passed. Ohio appears on Milliman's limit list at 15%, but only for an expedited review the department offers when an increase stays within that amount. Approved Ohio filings averaged a 30% increase.

Where Do Long-Term Care Rate Requests Stall?

New York had the highest pending share among the long-term care filings in Milliman's survey, with 79% still pending and only four decided. Hawaii (68%), Idaho (58%) and California (50%) also had large shares of filings still pending.

Colorado took the longest to approve long-term care filings, at an average of 22 months, followed by Rhode Island at 18 months. California, Delaware, Indiana, New York and Vermont each averaged 17 months. Insurers in Milliman's survey named California, Florida, New Jersey, New York and Texas among the jurisdictions that take the most effort to get a filing approved.

MoneyGeek didn't rank California, Florida, Hawaii, New York or Puerto Rico on rate cuts because each had fewer than 10 decided filings, too few for a reliable average.

What Did Regulators Approve in Specific Filings?

In 45 examples from state insurance department records in Maine, Vermont, Virginia, Pennsylvania, Indiana and Massachusetts, regulators reduced 32 requests, denied six and approved seven in full. Requests under 50% fared best: regulators approved a median 93% of those asks, compared with 38% for requests of 50% or more. The examples aren't a random sample.

Maine cut several large requests in 2025 and 2026. The State Life Insurance Company asked for 424% on one block of policies and got 71.5%. Metropolitan Life's 140.82% request on another block was cut to 5.3%, and Lincoln Benefit Life's 308% request ended at 95.3%.  

Vermont made similar cuts. Union Security Insurance Company's average request of 423% was approved at 121%, and Vermont's 21% approval on Genworth's Choice 2 policies covered 2,084 policyholders.

Pennsylvania approved 20% for Genworth's Choice I policies in March 2021, after requests averaging 83.8% for policies issued before Sept. 16, 2002, and 60.9% for later ones. The decision covered 12,900 policies.

Massachusetts' denial of Genworth's 161.6% request covered 10,899 in-force lives. A Division of Insurance hearing decision in April 2024 upheld it.

Approval in full still happens. Virginia approved State Farm's 80.1% request but spread it over five years instead of three. Pennsylvania approved RiverSource Life's 46.9% request as filed in 2022, phased in through three annual increases.

Do Lower Approvals Keep Long-Term Care Premiums Low?

Not always. Milliman found that when a state denied, cut or delayed a request, about 60% of filings came back with a follow-up request designed to reach the same financial result. For a policyholder in a low-approval state, that can mean smaller increases that arrive more often.  

Phase-ins spread an approved increase over several years. Milliman found that 41% of insurers asked for a phased-in increase in at least one state, and some states require one as a condition of approval. In Maryland, 85% of approvals were phased in, over two to five years.

What Can You Do When Your Long-Term Care Premium Goes Up?

You can usually keep paying the higher premium or reduce your benefits to hold the premium near its current level. Milliman's survey found an average of 11.9% of affected policyholders chose a benefit reduction. Stopping payments is the riskiest choice. Before you stop, get written confirmation of any nonforfeiture or contingent paid-up benefit you qualify for and the deadline to choose it. Without one, a lapsed policy can leave you with no coverage.

Insurers commonly offer these options with a rate increase:

  1. 1

    Lower your daily or monthly benefit amount. Coverage continues with a smaller payout.

  2. 2

    Shorten your benefit period, such as moving from a lifetime benefit to three or five years.

  3. 3

    Lengthen your elimination period (the waiting period before benefits start).

  4. 4

    Reduce or drop inflation protection to lower the premium. Future benefits will grow less or not at all.

  5. 5

    Take a contingent benefit upon lapse, if offered, which converts your policy into paid-up coverage. It isn't a cash refund, and you still have to qualify for a claim to use it. Milliman found an average of 2.0% of affected policyholders chose this option.

The approval that applies to you usually comes from the state where your individual policy or group certificate was issued, not where you live now. Genworth's group long-term care FAQ says the increase approved "is based on the state where your certificate was issued." Massachusetts notes that policies approved through the Interstate Insurance Product Regulation Commission go through a separate review. A policyholder whose certificate was issued in Georgia may still see Georgia's decision after moving to Wisconsin. Ask your insurer which state's approval governs your increase.

Timing rules vary by state. Texas requires at least 45 days' notice of a long-term care rate increase and at least one way to reduce benefits. Massachusetts requires at least 90 days' notice before renewal for individual policies. Check your notice for the deadline to choose an option, since missing it usually means the full increase takes effect.

Before reducing inflation protection, check whether your policy is a long-term care Partnership policy. Washington's Office of the Insurance Commissioner says Partnership policies protect most assets up to the amount of benefits the policy has paid when you qualify for Medicaid, and that Partnership inflation protection depends on your age. Rules vary by state, so ask your insurer whether a benefit change affects your policy's Partnership status. Your state insurance department's consumer line can also explain your options at no cost.

Dropping long-term care coverage shifts the cost of care to your own savings unless you qualify for Medicaid, because Medicare doesn't pay for most long-term care, including care in a nursing home or in the community. A Medicare Supplement plan pays some of Medicare's cost-sharing for hospital and skilled nursing stays, but it doesn't cover custodial long-term care either.

Some life insurance policies offer separate long-term care riders or hybrid coverage, with their own benefit limits and eligibility rules. A standard accelerated death benefit rider isn't the same as long-term care insurance. It pays part of the death benefit early if you meet the policy's illness rules, such as a terminal diagnosis, and reduces what beneficiaries receive.

How Much Does Long-Term Care Cost Without Insurance?

CareScout's 2025 Cost of Care Survey found national median annual costs of $80,080 for a non-medical in-home caregiver at 44 hours a week, $74,400 for assisted living, $114,975 for a semi-private nursing home room and $129,575 for a private room. Before you reduce or drop coverage, compare those costs with your premium and use MoneyGeek's retirement calculator to see how a higher premium fits your retirement income.

Methodology

MoneyGeek based its state rankings on Milliman's "Long-term care rate increase survey," published in April 2025. The survey covers 37 nationwide rate increase filings from 16 insurers, with results reported across 50 states, Washington, D.C., and Puerto Rico for submissions made mostly from 2021 to 2024. Its results are a historical snapshot of those submissions, and current regulatory decisions may differ. Milliman's 28% average approved increase is premium-weighted across jurisdictions with a decision and counts denials as 0%. MoneyGeek used Milliman's jurisdiction-level results to calculate three measures:

  1. Share of requested increase allowed (denial-adjusted approval ratio): Milliman's ratio of average approved to average requested increase on approved filings, multiplied by the share of decided filings that were approved. Denied filings count as zero. Pending filings are excluded. The result is an estimate built from state-level averages.
  2. Pending filings: the share of filings still awaiting a decision. Denied filings are reported separately.
  3. Approval time: the average number of months from submission to approval, for approved filings only.

About Myryah Irby


Myryah Irby, Writer and Data Journalist

Myryah Irby is a writer and data journalist at MoneyGeek. Her work spans original data studies and how-to guides covering auto, home and health insurance, consumer costs and transportation safety.

Research and Analysis

Since joining MoneyGeek in late 2025, Irby has produced data studies on insurance costs, consumer spending and transportation risk. Her published work includes a 50-state analysis of winter driving danger using fatality and weather severity data; research tracking the relationship between rhodium commodity prices and catalytic converter theft rates, including state-level theft trends and what those rates mean for insurance costs; a state-by-state comparison of winter home heating costs; and an analysis of the full cost of having a baby in America: hospital bills, insurance and out-of-pocket expenses.

Career

Irby has more than 20 years of editorial and writing experience. Since 2005, she has run Irby x Irby, her own editorial and copywriting practice, with clients including The New York Times, The San Francisco Chronicle, OpenAI and the National Park Service. From 2019 to 2023, she served as Senior Managing Editor and then Copywriting Manager at Callisto Media, a nonfiction publisher acquired by Penguin Random House in May 2023, where she led a team of writers and graphic designers.

Before that, she spent nearly 11 years at QuinStreet, a performance marketing company that runs content and comparison sites in insurance and personal finance. She rose from Managing Editor to Senior Managing Editor between 2010 and 2016. Earlier in her career, she edited at Collabrys for nearly four years and tutored doctoral candidates on dissertation writing at the University of San Francisco.


Sources