The Year Your State’s Minimum Car Insurance Fell Behind the Average Claim

Updated: November 6, 2026

Advertising & Editorial Disclosure

In 36 states, the least bodily injury coverage a driver can legally buy is less than the average injury claim insurers paid in 2024: $28,278.

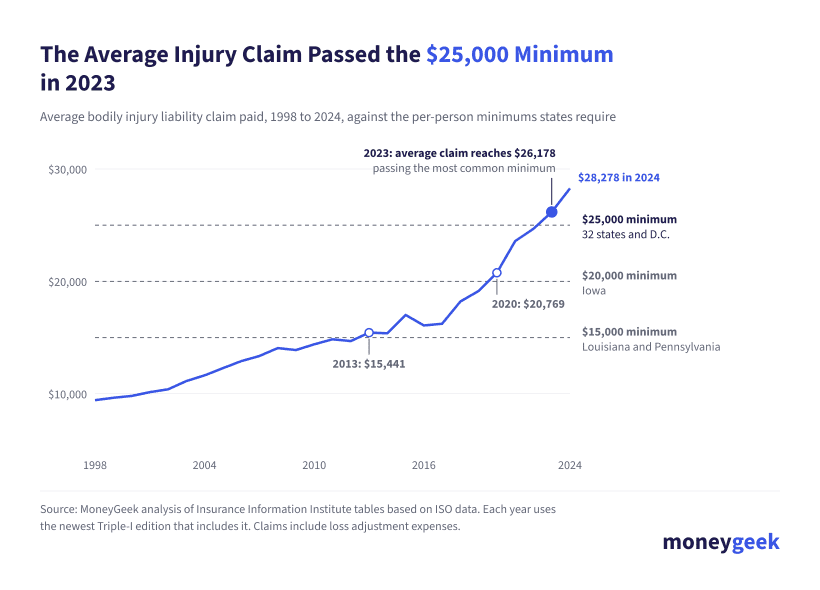
Louisiana shows how fast that can happen. The state raised its per-person minimum to $15,000 on Jan. 1, 2010. By 2013, the national average bodily injury claim was $15,441, higher than the limit Louisiana had set three years earlier. For most states, the date came in 2023, when the average claim passed $25,000.

MoneyGeek compared each state’s liability minimums with average paid claims from 1998 to 2024, using Insurance Information Institute (Triple-I) tables built on ISO data. For every limit, the study finds the first year the average claim was higher. It also adjusts each minimum for inflation since the year it took effect and checks property damage limits against what a car costs today.

A minimum that falls behind the average claim still pays up to its limit. What changes is who covers the rest. When an injury claim runs past the at-fault driver’s limit, that driver can owe the difference, and the injured person may have to rely on their own uninsured and underinsured motorist coverage.

mglogo icon
STUDY FINDINGS
  • The average injury claim is higher than the minimum in 36 states. Insurers paid an average of $28,278 per bodily injury claim in 2024. The per-person minimum is $25,000 or less in 36 states and Washington, D.C.
  • The $25,000 minimum fell behind in 2023. That year the average claim reached $26,178, passing the $25,000 limit in 32 states and D.C. Iowa’s $20,000 limit fell behind in 2020, and the $15,000 limits in Louisiana and Pennsylvania fell behind in 2013.
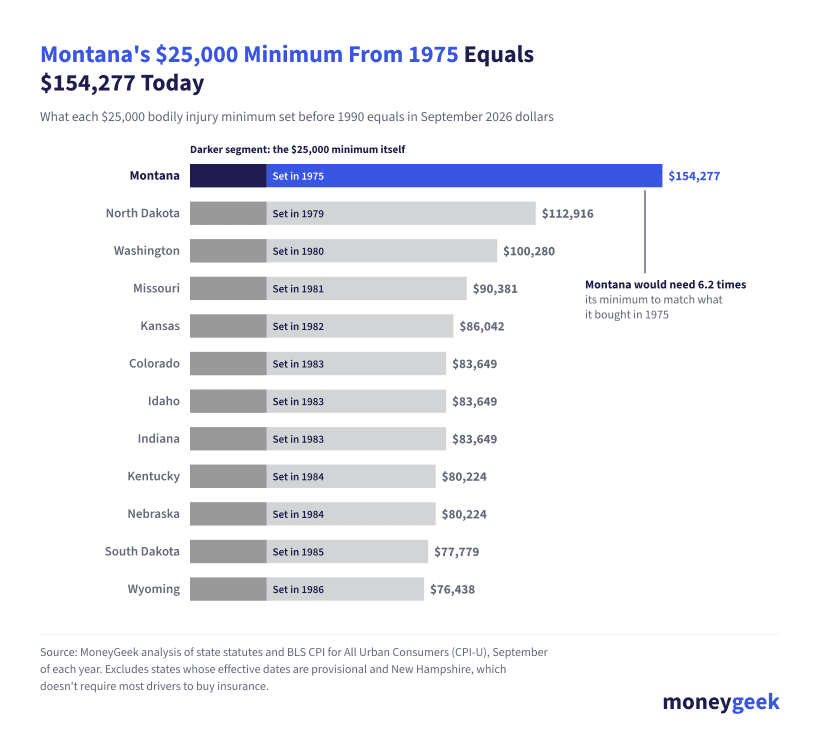
  • Most minimums are decades old. Twenty-five of the 48 states that require bodily injury coverage set their current minimum in 2001 or earlier. In 24 states, the bodily injury minimum would need to more than double to buy what it did when it took effect. Montana’s $25,000 limit from 1975 equals $154,277 in September 2026 dollars.
  • Claims have grown faster than prices. From 1998 to 2024, the average injury claim rose 200% and the average property damage claim rose 202%. Consumer prices rose 92% and medical care prices rose 133%.
  • Pennsylvania’s $5,000 property damage limit is the only one the average claim has passed. The average property damage claim passed $5,000 in 2021 and reached $6,770 in 2024.
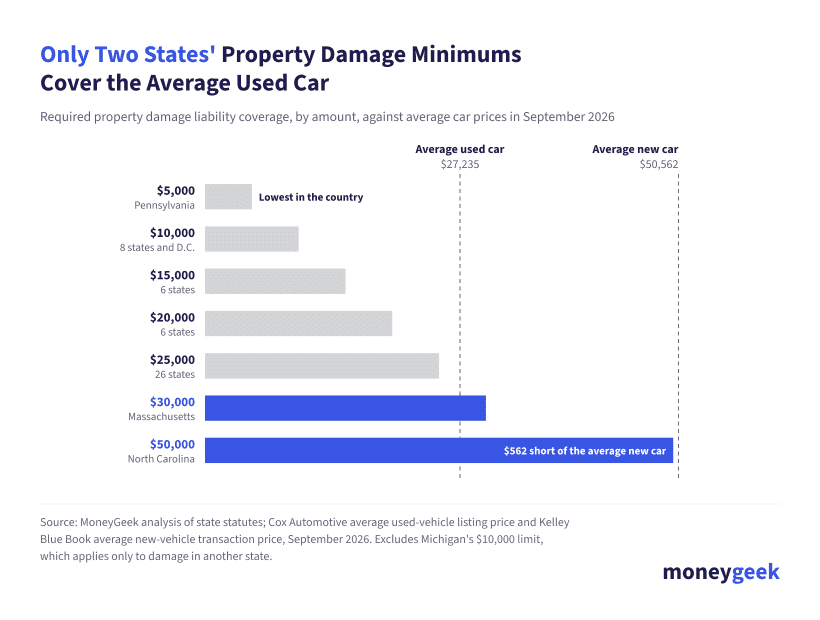
  • Two states’ property damage minimums cover the average used car. Only Massachusetts ($30,000) and North Carolina ($50,000) require more than the $27,235 average used-car listing price in September 2026.
Average injury claim passed $25,000 in 2023

When the Average Claim Passed Each State’s Minimum

The average bodily injury claim first topped $15,000 in 2013, $20,000 in 2020 and $25,000 in 2023. The year a state’s limit fell behind depends on its amount and the year it took effect.

Six states have bodily injury minimums the average claim hasn’t reached: Alaska, Maine and Michigan at $50,000 and Maryland, Minnesota and Texas at $30,000. Seven states raised their limits in 2025 or 2026, after the last year of claims data. One of them, Massachusetts, set its new per-person minimum at $25,000 in July 2025, below the 2024 average claim.

The $28,278 average is a claims figure: what insurers paid per bodily injury claim, including what it cost to settle it. MoneyGeek’s study of minimums and hospital costs compared the same limits with a different benchmark, the $25,179 average cost of an injury-related hospital stay.

Alabama
$25,000
2008
2023
$25,000
2008
Not yet
Alaska
$50,000
1985
Not yet
$25,000
1985
Not yet
Arizona
$25,000
2020
2023
$15,000
2020
Not yet
Arkansas
$25,000
1981*
2023
$25,000
1999
Not yet
California
$30,000
2025
Set after 2024
$15,000
2025
Set after 2024
Colorado
$25,000
1983
2023
$15,000
1983
Not yet
Connecticut
$25,000
2018
2023
$25,000
2018
Not yet
Delaware
$25,000
2017
2023
$10,000
2017
Not yet
Florida
Not required
N/A
N/A
$10,000
1989
Not yet
Georgia
$25,000
2001
2023
$25,000
2001
Not yet
Hawaii
$40,000
2026
Set after 2024
$20,000
2026
Set after 2024
Idaho
$25,000
1983
2023
$15,000
1983
Not yet
Illinois
$25,000
2015
2023
$20,000
2015
Not yet
Indiana
$25,000
1983
2023
$25,000
2017
Not yet
Iowa
$20,000
1983
2020
$15,000
1983
Not yet
Kansas
$25,000
1982
2023
$25,000
2017
Not yet
Kentucky
$25,000
1984
2023
$25,000
2018
Not yet
Louisiana
$15,000
2010
2013
$25,000
2010
Not yet
Maine
$50,000
1998
Not yet
$25,000
1998
Not yet
Maryland
$30,000
2011
Not yet
$15,000
1999
Not yet
Massachusetts
$25,000
2025
Set after 2024
$30,000
2025
Set after 2024
Michigan
$50,000
2020
Not yet
$10,000
1971
Not yet
Minnesota
$30,000
1985
Not yet
$10,000
1975
Not yet
Mississippi
$25,000
2006
2023
$25,000
2006
Not yet
Missouri
$25,000
1981
2023
$25,000
2019
Not yet
Montana
$25,000
1975
2023
$20,000
2016
Not yet
Nebraska
$25,000
1984
2023
$25,000
1984
Not yet
Nevada
$25,000
2018
2023
$20,000
2018
Not yet
New Hampshire
$25,000
1982
2023
$25,000
1982
Not yet
New Jersey
$35,000
2026
Set after 2024
$25,000
2023
Not yet
New Mexico
$25,000
1984*
2023
$10,000
1984*
Not yet
New York
$25,000
1996
2023
$10,000
1996
Not yet
North Carolina
$50,000
2025
Set after 2024
$50,000
2025
Set after 2024
North Dakota
$25,000
1979
2023
$25,000
1985
Not yet
Ohio
$25,000
2013
2023
$25,000
2013
Not yet
Oklahoma
$25,000
2005
2023
$25,000
2005
Not yet
Oregon
$25,000
1983*
2023
$20,000
2010
Not yet
Pennsylvania
$15,000
1984
2013
$5,000
1984
2021
Rhode Island
$25,000
1976*
2023
$25,000
1992
Not yet
South Carolina
$25,000
2007
2023
$25,000
2007
Not yet
South Dakota
$25,000
1985
2023
$25,000
1985
Not yet
Tennessee
$25,000
1990
2023
$25,000
2023
Not yet
Texas
$30,000
2011
Not yet
$25,000
2008
Not yet
Utah
$30,000
2025
Set after 2024
$25,000
2025
Set after 2024
Vermont
$25,000
1999
2023
$10,000
1980*
Not yet
Virginia
$50,000
2025
Set after 2024
$25,000
2025
Set after 2024
Washington
$25,000
1980
2023
$10,000
1980
Not yet
West Virginia
$25,000
2016
2023
$25,000
2016
Not yet
Wisconsin
$25,000
2011
2023
$10,000
2011
Not yet
Wyoming
$25,000
1986
2023
$20,000
1986
Not yet
Washington, D.C.
$25,000
1986
2023
$10,000
1986
Not yet

What State Minimums Have Lost to Inflation

Washington’s $25,000 per-person minimum took effect in 1980. To buy what $25,000 bought then, a driver would need $100,280 in September 2026. North Dakota’s limit, from 1979, would need $112,916, and Montana’s, from 1975, would need $154,277.

In 24 states, the bodily injury minimum would need to more than double to match its value when it took effect. Five of those 24 have provisional dates, and dropping them leaves 19. Higher limits lost value too. Alaska’s $50,000 minimum from 1985 equals $155,559 today, and Maine’s $50,000 from 1998 equals $102,977.

Medical prices have risen faster than prices overall, and adjusting for them makes the loss larger. On medical-care prices, Montana’s $25,000 equals $306,006.

Montana’s 1975 minimum equals $154,277 today
Alabama
$25,000
2008
$38,502
$40,657
$25,000
2008
$38,502
Alaska
$50,000
1985
$155,559
$258,109
$25,000
1985
$77,779
Arizona
$25,000
2020
$32,363
$28,403
$15,000
2020
$19,418
Arkansas
$25,000
1981*
$90,381
$174,809
$25,000
1999
$50,170
California
$30,000
2025
$31,121
$30,451
$15,000
2025
$15,561
Colorado
$25,000
1983
$83,649
$145,932
$15,000
1983
$50,190
Connecticut
$25,000
2018
$33,368
$30,619
$25,000
2018
$33,368
Delaware
$25,000
2017
$34,128
$31,147
$10,000
2017
$13,651
Florida
Not required
N/A
N/A
N/A
$10,000
1989
$26,955
Georgia
$25,000
2001
$47,243
$53,968
$25,000
2001
$47,243
Hawaii
$40,000
2026
$40,000
$40,000
$20,000
2026
$20,000
Idaho
$25,000
1983
$83,649
$145,932
$15,000
1983
$50,190
Illinois
$25,000
2015
$35,401
$33,181
$20,000
2015
$28,321
Indiana
$25,000
1983
$83,649
$145,932
$25,000
2017
$34,128
Iowa
$20,000
1983
$66,920
$116,746
$15,000
1983
$50,190
Kansas
$25,000
1982
$86,042
$156,885
$25,000
2017
$34,128
Kentucky
$25,000
1984
$80,224
$137,547
$25,000
2018
$33,368
Louisiana
$15,000
2010
$23,137
$22,797
$25,000
2010
$38,562
Maine
$50,000
1998
$102,977
$121,700
$25,000
1998
$51,488
Maryland
$30,000
2011
$44,551
$44,346
$15,000
1999
$30,102
Massachusetts
$25,000
2025
$25,934
$25,376
$30,000
2025
$31,121
Michigan
$50,000
2020
$64,726
$56,806
$10,000
1971
Excluded
Minnesota
$30,000
1985
$93,335
$154,865
$10,000
1975
$61,711
Mississippi
$25,000
2006
$41,516
$43,870
$25,000
2006
$41,516
Missouri
$25,000
1981
$90,381
$174,809
$25,000
2019
$32,807
Montana
$25,000
1975
$154,277
$306,006
$20,000
2016
$27,912
Nebraska
$25,000
1984
$80,224
$137,547
$25,000
1984
$80,224
Nevada
$25,000
2018
$33,368
$30,619
$20,000
2018
$26,695
New Hampshire
$25,000
1982
$86,042
$156,885
$25,000
1982
$86,042
New Jersey
$35,000
2026
$35,000
$35,000
$25,000
2023
$27,368
New Mexico
$25,000
1984*
$80,224
$137,547
$10,000
1984*
$32,090
New York
$25,000
1996
$53,381
$64,696
$10,000
1996
$21,352
North Carolina
$50,000
2025
$51,869
$50,752
$50,000
2025
$51,869
North Dakota
$25,000
1979
$112,916
$216,345
$25,000
1985
$77,779
Ohio
$25,000
2013
$35,975
$34,674
$25,000
2013
$35,975
Oklahoma
$25,000
2005
$42,372
$45,722
$25,000
2005
$42,372
Oregon
$25,000
1983*
$83,649
$145,932
$20,000
2010
$30,850
Pennsylvania
$15,000
1984
$48,134
$82,528
$5,000
1984
$16,045
Rhode Island
$25,000
1976*
$146,241
$280,553
$25,000
1992
$59,614
South Carolina
$25,000
2007
$40,402
$41,957
$25,000
2007
$40,402
South Dakota
$25,000
1985
$77,779
$129,055
$25,000
1985
$77,779
Tennessee
$25,000
1990
$63,478
$89,513
$25,000
2023
$27,368
Texas
$30,000
2011
$44,551
$44,346
$25,000
2008
$38,502
Utah
$30,000
2025
$31,121
$30,451
$25,000
2025
$25,934
Vermont
$25,000
1999
$50,170
$58,824
$10,000
1980*
$40,112
Virginia
$50,000
2025
$51,869
$50,752
$25,000
2025
$25,934
Washington
$25,000
1980
$100,280
$194,767
$10,000
1980
$40,112
West Virginia
$25,000
2016
$34,890
$31,634
$25,000
2016
$34,890
Wisconsin
$25,000
2011
$37,126
$36,955
$10,000
2011
$14,850
Wyoming
$25,000
1986
$76,438
$119,881
$20,000
1986
$61,151
Washington, D.C.
$25,000
1986
$76,438
$119,881
$10,000
1986
$30,575

Claims Have Grown Faster Than Prices

From 1998 to 2024, the average bodily injury claim rose from $9,437 to $28,278, an increase of 200%. The average property damage claim rose from $2,240 to $6,770, an increase of 202%. Over the same years, consumer prices rose 92% and medical care prices rose 133%.

Claims kept outpacing prices in the most recent decade. From 2015 to 2024, injury claims rose 66% and property damage claims rose 87%, while consumer prices rose 32% and medical prices rose 26%. These figures show how fast claims grew. They don’t show why.

pennsylvania icon
PENNSYLVANIA’S $5,000 PROPERTY DAMAGE LIMIT

Pennsylvania’s property damage minimum, $5,000, is the lowest in the country and dates to 1984. The average property damage claim passed it in 2021 and reached $6,770 in 2024. No other state’s property damage minimum has fallen behind the average claim, because every other state requires at least $10,000.

Pennsylvania’s bodily injury minimum, $15,000 per person, is tied with Louisiana’s for the lowest of any state that requires the coverage. In September 2026 dollars, its 1984 limits equal $48,134 for injuries and $16,045 for property damage.

Only Two States’ Property Damage Minimums Cover a Used Car

A property damage claim often pays for a repair, and a totaled car costs more. Cox Automotive put the average used-car listing price at $27,235 in September 2026. Only Massachusetts and North Carolina require property damage coverage above that. The average new vehicle sold for $50,562, which is $562 more than North Carolina’s $50,000 minimum.

Two states’ damage minimums top used-car cost
$5,000
Pennsylvania
18%
10%
$10,000
Delaware, Florida, Minnesota, New Mexico, New York, Vermont, Washington, Wisconsin and D.C.
37%
20%
$15,000
Arizona, California, Colorado, Idaho, Iowa and Maryland
55%
30%
$20,000
Hawaii, Illinois, Montana, Nevada, Oregon and Wyoming
73%
40%
$25,000
Alabama, Alaska, Arkansas, Connecticut, Georgia, Indiana, Kansas, Kentucky, Louisiana, Maine, Mississippi, Missouri, Nebraska, New Hampshire, New Jersey, North Dakota, Ohio, Oklahoma, Rhode Island, South Carolina, South Dakota, Tennessee, Texas, Utah, Virginia and West Virginia
92%
49%
$30,000
Massachusetts
110%
59%
$50,000
North Carolina
184%
99%

The Same $40,000 Injury Claim Under Two Minimum Policies

Say a driver at fault in a crash injures one person, and the injured person’s covered damages come to $40,000 after any payments from their own policy. The insurer accepts the claim, and no one else is hurt.

Pennsylvania
$40,000
$15,000
$15,000
$25,000
North Carolina
$40,000
$50,000
$40,000
$0

Where Uninsured and Underinsured Motorist Coverage Fits

Uninsured motorist (UM) coverage pays when the driver who hit you has no insurance. Underinsured motorist (UIM) coverage pays when that driver’s limits are too low for your damages. In the Pennsylvania example, the injured person’s own UIM coverage could pay some of the $25,000 above the at-fault driver’s limit. Pennsylvania requires insurers to offer UM and UIM, but buyers can reject both in writing.

Some states require UM or UIM on every policy. Others require insurers to offer it and let drivers turn it down. Amounts, rejection rules and how claims are paid vary by state, and MoneyGeek’s uninsured motorist statistics show how many drivers in each state have no insurance at all.

How to Check Whether Your Coverage Keeps Up

Your declarations page lists your liability limits, usually as three numbers. These steps compare those limits with the averages in this study and show what to ask your insurer before your next renewal.

  1. 1
    Compare your limits with the averages.

    If your bodily injury limit is $25,000 per person or less, it’s below the 2024 average claim of $28,278. If your property damage limit is less than $27,235, it won’t cover the average used car.

  2. 2
    Look at the per-person limit.

    The first number on your declarations page, such as 25/50/25, is the most your insurer pays for one injured person. A higher per-accident limit doesn’t raise it.

  3. 3
    Check your UM and UIM coverage.

    It’s the coverage that pays you when the other driver’s limits run out. Ask whether you rejected it when you bought the policy.

  4. 4
    Price a higher limit.

    Ask for quotes at your current limits and at one or two higher levels, such as 50/100/50 and 100/300/100. The difference varies by insurer and state. MoneyGeek’s study of minimums and hospital costs shows how far each state’s limits go toward a hospital stay.

How Long the New Minimums May Last

Seven states raised their minimums in 2025 or 2026: California, Hawaii, Massachusetts, New Jersey, North Carolina, Utah and Virginia. Their new limits took effect after the last year of claims data. Whether the average claim has passed them isn’t known yet. MoneyGeek projected it two ways, using the average claim’s annual growth from 2015 to 2024 (5.8%) and from 2019 to 2024 (8.1%).

$30,000
California, Maryland, Minnesota, Texas, Utah
2026
2025
$35,000
New Jersey
2028
2027
$40,000
Hawaii
2031
2029
$50,000
Alaska, Maine, Michigan, North Carolina, Virginia
2035
2032

At those rates, the average claim would pass $30,000 in 2025 or 2026. California and Utah set their new per-person minimums at $30,000 in 2025. Maryland, Minnesota and Texas have had that limit for years. The $50,000 limits in North Carolina and Virginia hold out until 2032 to 2035. The $25,000 limit fell behind in 2023. Raising it to $30,000 adds two or three years at recent growth rates, and doubling it to $50,000 adds about a decade.

Methodology

MoneyGeek compared each state’s liability minimums with the national average claim insurers paid each year from 1998 to 2024, using Triple-I tables built on ISO data. For each limit, the analysis finds the first year the average claim was higher and adjusts the limit for inflation with BLS consumer price data. It also compares property damage minimums with September 2026 car prices and projects when recent claim growth would pass the newest limits.

About Nathan Paulus


Nathan Paulus, Head of Content and SEO, MoneyGeek

Nathan Paulus is the Head of Marketing and Brand Partnerships at MoneyGeek, where he leads content strategy and conducts original data research across insurance, consumer costs, transportation safety, housing, public policy and personal finance. He reviews studies for methodology, source quality and factual accuracy.

Research and Analysis

In more than six years at MoneyGeek, Nathan has published more than 100 original studies and explanatory guides. His insurance research includes 50-state comparisons of health care outcomes, costs and access, and an analysis of how uninsured rates track with state Medicaid expansion decisions and electoral patterns. 

He has analyzed full-coverage auto rates across major insurers in all 50 states and tracked how premium trends relate to industry underwriting losses. That research draws on combined ratio data from Fitch Ratings and AM Best, plus the Bureau of Labor Statistics CPI figures. Beyond insurance, his work spans vehicle pricing trends across the U.S. new car market, summer traffic fatality rates by state, homeowner underinsurance ratios using mortgage and policy data, and housing affordability across all 50 states.

His research has been cited by Bloomberg, the Los Angeles Times, Forbes, Fast Company, the San Francisco Chronicle, USA Today and NBC Los Angeles. Harvard, MIT, Stanford and Yale have referenced his work.

Career

Nathan traces his interest in personal finance back to his grandmother, who ran her household on a simple rule: spend less than you make and save the difference before anything else. That rule shows up in his work today. His writing skips jargon and complex strategy in favor of the basics that help someone living paycheck to paycheck.

He joined MoneyGeek in July 2020 as Director of Content Marketing, where he led the content team and oversaw data journalism production across insurance and personal finance verticals. A promotion to Head of Marketing and Communications followed in December 2023. The new role added digital PR and communications strategy to his responsibilities. He was appointed Head of Content and SEO in January 2025.

Before MoneyGeek, Nathan served as Director of Content Marketing and SEO at Ventrix Advertising, where he helped build two content sites from scratch, contributed to link-building programs that generated more than 1,500 unique referring domains within a year and co-managed a marketing team of more than 20 people. Two and a half years at ABUV Media preceded that role. He advanced from Marketing Research Analyst to Senior Marketing Tactics Analyst, where he built expertise in audience research, content strategy and SEO.


Sources