
Federal Surprise-Billing Arbitration Drew 2.6 Million Disputes in 2025, Far Above Projections

Advertising & Editorial Disclosure

Federal regulators projected 17,333 non-air-ambulance payment disputes a year when they built the No Surprises Act's arbitration system in 2021. The process works like a referee: when an out-of-network provider and a health plan disagree over payment, it keeps the patient out of the fight and picks one side's final offer.

Before the No Surprises Act took effect in 2022, patients could receive large unexpected bills after emergency care, air ambulance rides or treatment from an out-of-network clinician at an in-network hospital. The law bars those surprise bills in most cases and limits what patients owe to their usual in-network cost sharing. It shifted the remaining payment fight to providers and health plans, which can use federal arbitration if they can't agree on a price.

Providers and facilities initiated 2,516,173 of those non-air-ambulance disputes in 2025 alone, 145 times the projected rate, according to CMS Federal Independent Dispute Resolution (IDR) data through the fourth quarter of 2025. Including air ambulance cases, the federal system received 2,559,375 disputes for the year, and volume kept climbing through the back half: 1,372,563 disputes were initiated in the second half of 2025, 16% more than the 1,186,812 initiated in the first half.
How Far Off Was the Government's Projection?

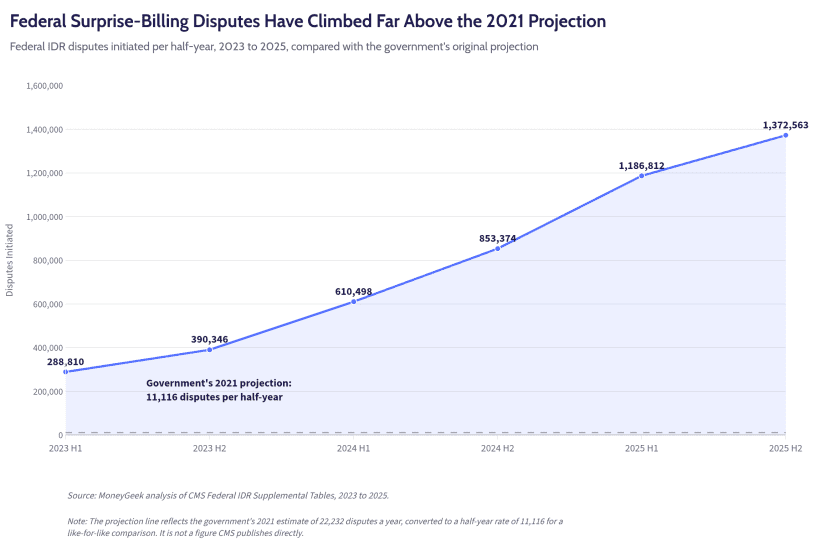
The Departments of Health and Human Services, Labor and the Treasury estimated in the October 2021 interim final rules that the Federal IDR process would receive 17,333 non-air-ambulance disputes and 4,899 air ambulance disputes a year, for a combined 22,232 disputes annually.

MoneyGeek's analysis of full-year 2025 IDR data found 2,516,173 non-air-ambulance disputes were initiated, 145.2 times the government's projected rate for that category. Air ambulance disputes totaled 43,202 in 2025, 8.8 times the projection. Combined, the 2,559,375 disputes initiated in 2025 ran at 115.1 times the government's original estimate for the whole program.

Every half-year period in the CMS data, beginning in 2023, shows growth: 288,810 disputes in the first half of 2023, 390,346 in the second half, 610,498 in the first half of 2024, 853,374 in the second half, 1,186,812 in the first half of 2025 and 1,372,563 in the second half of 2025, per CMS Federal IDR Supplemental Tables.

Volume didn't stop at the end of 2025. CMS's bi-monthly operational updates, which run ahead of the formal PUF releases, show 1,433,289 more disputes initiated between January and May 2026 alone. The figures in this analysis reflect the most recent full PUF release, through the fourth quarter of 2025, not the program's current, still-climbing total.

Federal IDR disputes initiated per half-year climbed from 288,810 in the first half of 2023 to 1,372,563 in the second half of 2025, far above the government's 2021 projection of about 11,116 per half-year.

How Does the Federal IDR Process Work?

The Federal IDR process lets an out-of-network provider or a health plan settle a payment dispute through binding arbitration after a mandatory 30-business-day negotiation period fails. A dispute reaches this stage only after the health plan has processed the underlying claim, the formal payment request. MoneyGeek's guide explains =.

Once a dispute reaches arbitration, each side submits a single best offer to a certified IDR entity, one of 15 organizations authorized to decide cases as of June 2025, when the Departments certified two more, Capitol Bridge and Livanta. The entity picks one offer as the final payment amount. It can't split the difference or choose a number in between. Arbitrators must weigh the qualifying payment amount (QPA), a benchmark tied to 2019 median in-network rates adjusted for inflation, though they can also consider other factors, such as a provider's training or a case's complexity.

Emergency department visits made up 52% of second-half 2025 payment determinations, the largest single category, followed by radiology services at 15%. The law's protections apply to emergency scenarios, not routine urgent care visits. The No Surprises Act also protects patients from balance billing for air ambulance transport and for care from an out-of-network provider at an in-network facility, such as an anesthesiologist or radiologist the patient didn't choose. MoneyGeek's breakdown of in-network vs. out-of-network coverage explains how the law's emergency-care cost-sharing cap works.

Who Wins Federal IDR Disputes, and by How Much?

Providers, facilities and air ambulance companies won approximately 85% of Federal IDR payment determinations in the second half of 2025, down slightly from 88% in the first half of the year, according to CMS. Health plans and issuers won about 14% of determinations, with the remainder split decisions.

The prevailing offer beat the health plan's qualifying payment amount in about 87% of determinations made in the second half of 2025, per CMS's supplemental background report. MoneyGeek's review of the underlying IDR Public Use Files found the median prevailing offer nationally, across 3,480,851 disputes with a closed payment determination between 2023 and 2025, ran at 390% of the QPA, or almost four times the benchmark health plans use to set their initial payment.

Default decisions, in which one side failed to submit an offer or pay required fees, made up 17% of second-half 2025 determinations, down from 22% in the first half. Providers won 90% of those defaults.

A Few Companies File Most of the Disputes

Ten initiating parties accounted for 66% of all disputes initiated in the second half of 2025, and three companies alone, HaloMD, Team Health and SCP Health, initiated 38% of them, according to CMS. These aren't three doctors filing disputes personally.

Team Health and SCP Health staff emergency rooms and other hospital departments with thousands of physicians nationwide, while companies such as HaloMD manage medical billing and dispute filing for physician groups and hospitals as a service. When one of those doctors has an underpaid out-of-network claim, the company managing that doctor's billing files the dispute, which is why a handful of company names can represent such a large share of the total volume.

Health care facilities initiated 24% of second-half 2025 disputes, up from 19% in the first half, while individual providers and their representatives initiated the rest. The concentration means a small number of billing operations, not a broad swath of the medical profession, generated most of the volume beyond the government's 2021 projection.

Which States Have the Most Surprise Billing Disputes?

Texas generated more Federal IDR payment determinations per capita than any other state between 2023 and 2025, at 4,044 per 100,000 residents, according to MoneyGeek's analysis of CMS IDR Public Use Files. Arizona ranked second at 3,274 per 100,000, followed by Tennessee at 2,043, New Jersey at 1,805 and Nevada at 1,798.

These state figures count payment determinations closed in the Federal IDR PUF, a different measure from the disputes-initiated figures used for the national half-year trend above. A dispute can sit open for months before it's assigned an outcome, so this ranking reflects determinations resolved between the first quarter of 2023 and the fourth quarter of 2025, not a single point-in-time snapshot of every dispute ever initiated.

Texas accounted for 1,282,446 payment determinations over the three-year period, more than a third of the national total, and providers won 85.52% of them. The median prevailing offer in Texas disputes reached 482% of the QPA, higher than the national median of 390%. Win rates in this ranking count a split decision as half a win for each side, MoneyGeek's own calculation choice, not a metric CMS publishes.

Texas and Arizona Lead the Nation in Federal IDR Disputes per Capita

Top five and bottom five states by Federal IDR payment determinations per 100,000 residents, 2023 to 2025

Source: MoneyGeek analysis of CMS Federal IDR Public Use Files (2023 Q1 to 2025 Q4) and U.S. Census Bureau Vintage 2025 population estimates.

Note: Figures count payment determinations closed in the Public Use Files, assigned to the most frequently listed state of service on each dispute's line items. Rankings cover the 50 states and Washington, D.C.

1
Texas
1,282,446
4,044.3
86
482
31,709,821
2
Arizona
249,598
3,273.9
84
443
7,623,818
3
Tennessee
149,438
2,042.9
82
281
7,315,076
4
New Jersey
172,308
1,804.6
85
1,134
9,548,215
5
Nevada
59,020
1,798.2
90
276
3,282,188
6
Oklahoma
68,331
1,657.2
91
494
4,123,288
7
Arkansas
50,716
1,628.2
87
453
3,114,791
8
Indiana
101,284
1,452.4
87
354
6,973,333
9
New Mexico
30,059
1,414.2
92
520
2,125,498
10
Louisiana
64,969
1,406.8
77
381
4,618,189
11
Georgia
139,030
1,230.1
85
290
11,302,748
12
Florida
281,469
1,199.7
89
257
23,462,518
13
Missouri
72,988
1,164.0
85
409
6,270,541
14
Virginia
84,690
953.7
85
296
8,880,107
15
Mississippi
25,618
867.2
86
310
2,954,160
16
South Carolina
38,346
688.4
84
295
5,570,274
17
New York
127,558
637.7
86
527
20,002,427
18
Ohio
75,669
635.8
86
251
11,900,510
19
Kentucky
28,130
610.6
88
335
4,606,864
20
Kansas
15,812
531.1
90
338
2,977,220
21
Alabama
24,996
481.3
88
443
5,193,088
22
North Carolina
49,063
438.1
86
253
11,197,968
23
West Virginia
7,438
421.1
88
400
1,766,147
24
Colorado
19,983
332.4
82
273
6,012,561
25
Rhode Island
3,633
326.0
83
351
1,114,521
26
Wyoming
1,887
320.5
78
229
588,753
27
Delaware
3,354
316.4
85
363
1,059,952
28
Alaska
2,286
310.1
80
247
737,270
29
Idaho
5,987
295.0
82
626
2,029,733
30
Illinois
33,555
263.8
88
426
12,719,141
31
Connecticut
9,347
253.4
87
324
3,688,496
32
Wisconsin
14,132
236.6
83
308
5,972,787
33
California
92,320
234.6
87
261
39,355,309
34
South Dakota
1,971
210.8
67
418
935,094
35
Pennsylvania
26,909
206.1
87
439
13,059,432
36
Michigan
19,100
188.6
90
379
10,127,884
37
Maryland
10,145
161.9
84
373
6,265,347
38
Iowa
4,658
143.8
81
279
3,238,387
39
Washington
9,849
123.1
89
231
8,001,020
40
Maine
1,684
119.0
91
288
1,414,874
41
Oregon
4,626
108.2
78
193
4,273,586
42
New Hampshire
1,394
98.5
78
322
1,415,342
43
District of Columbia
615
88.7
86
459
693,645
44
Montana
999
87.3
88
605
1,144,694
45
Utah
3,079
87.0
82
279
3,538,904
46
Massachusetts
6,198
86.6
83
240
7,154,084
47
Hawaii
934
65.2
82
559
1,432,820
48
Nebraska
1,277
63.3
88
300
2,018,006
49
North Dakota
252
31.5
85
215
799,358
50
Minnesota
1,610
27.6
86
522
5,830,405
51
Vermont
30
4.7
83
221
644,663

Vermont sat at the opposite end, with 4.7 payment determinations per 100,000 residents. Minnesota (27.6), North Dakota (31.5), Nebraska (63.3) and Hawaii (65.2) rounded out the five lowest per-capita rates.

Vermont's and Minnesota's low rates aren't a sign of a data problem or a state-law exemption. CMS's applicability chart confirms both states use the standard Federal IDR process, though this analysis doesn't test what explains those low rates.

How Do IDR Payment Disputes Differ from Claim Denials?

Federal IDR payment disputes and health insurance claim denials are different problems for different parties. A claim denial happens when a health plan refuses to pay a claim at all. The patient is then responsible for the bill unless they win an appeal, the subject of MoneyGeek's analysis of ACA claim denial rates by state and insurer. An IDR payment dispute happens after the health plan has already agreed to pay something. It's an argument between the provider and the health plan over how much, with the patient held harmless by law.

What This Means for Health Insurance Premiums

Federal IDR determinations that favor providers can raise what health plans pay for out-of-network care, and those payments feed into insurers' medical claims costs. Those costs are one input into future pricing, though this analysis doesn't estimate how much any single arbitration award moves a specific premium. Nationwide ACA marketplace premiums rose 20% for 2026, according to MoneyGeek's 50-state analysis of 2026 ACA premiums, a separate trend with many causes beyond IDR alone.

What Consumers Can Do

Patients aren't a party to Federal IDR disputes and can't be billed the difference between the arbitration award and their health plan's payment for a protected service, regardless of who wins. If a bill shows up anyway, patients can dispute it directly with the provider's billing office and file a complaint with the No Surprises Help Desk at 1-800-985-3059.

If a health plan denies a claim outright instead of paying a reduced amount, the fix is different: file an internal appeal within the plan's deadline, often 180 days, and escalate to an independent external review if the appeal fails. MoneyGeek's step-by-step guide to appealing a health insurance claim denial covers the process in detail.

Cost-sharing rules, including the deductible and the out-of-pocket maximum, determine how much of a bill a patient owes even in a worst-case scenario.

Methodology

MoneyGeek analyzed all payment determinations in the CMS Federal IDR Public Use Files, from 2023 through the most recent release. We compared dispute volume to the Departments' published first-year projection and computed state-level rates per 100,000 residents using Census Bureau population estimates.

About Myryah Irby


Myryah Irby, Writer and Data Journalist

Myryah Irby is a writer and data journalist at MoneyGeek. Her work spans original data studies and how-to guides covering auto, home and health insurance, consumer costs and transportation safety.

Research and Analysis

Since joining MoneyGeek in late 2025, Irby has produced data studies on insurance costs, consumer spending and transportation risk. Her published work includes a 50-state analysis of winter driving danger using fatality and weather severity data; research tracking the relationship between rhodium commodity prices and catalytic converter theft rates, including state-level theft trends and what those rates mean for insurance costs; a state-by-state comparison of winter home heating costs; and an analysis of the full cost of having a baby in America: hospital bills, insurance and out-of-pocket expenses.

Career

Irby has more than 20 years of editorial and writing experience. Since 2005, she has run Irby x Irby, her own editorial and copywriting practice, with clients including The New York Times, The San Francisco Chronicle, OpenAI and the National Park Service. From 2019 to 2023, she served as Senior Managing Editor and then Copywriting Manager at Callisto Media, a nonfiction publisher acquired by Penguin Random House in May 2023, where she led a team of writers and graphic designers.

Before that, she spent nearly 11 years at QuinStreet, a performance marketing company that runs content and comparison sites in insurance and personal finance. She rose from Managing Editor to Senior Managing Editor between 2010 and 2016. Earlier in her career, she edited at Collabrys for nearly four years and tutored doctoral candidates on dissertation writing at the University of San Francisco.


Sources