New York Deadly Road Maps

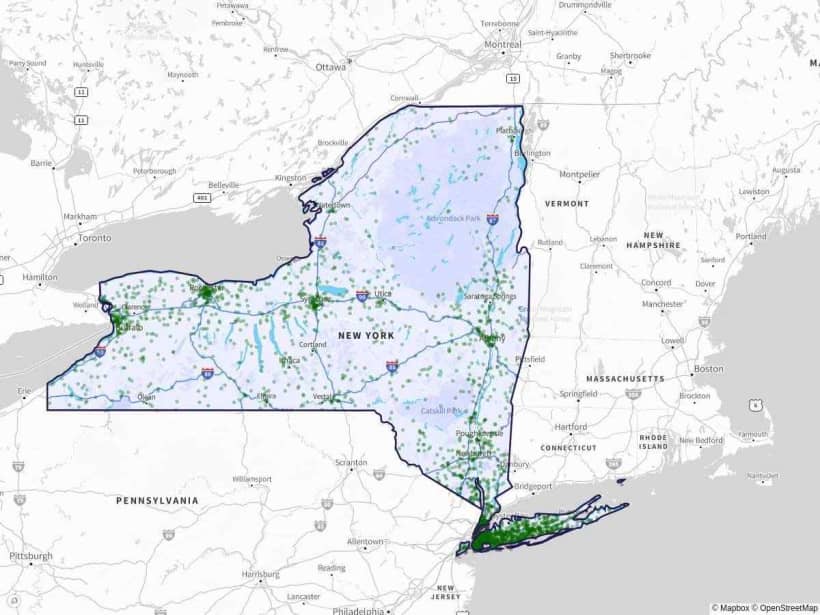
A total of 2,725 fatal vehicle accidents were recorded in New York from 2017 to 2019. MoneyGeek analyzed this information to find out which New York roads are the deadliest.

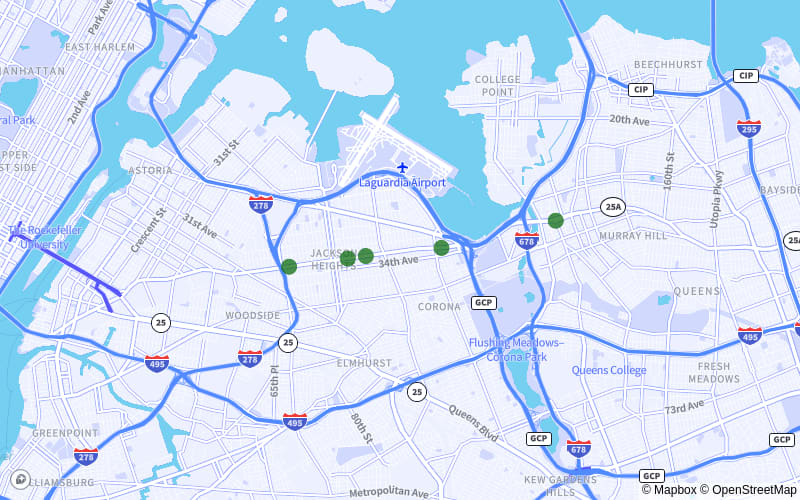
New York has a total of 240,489 miles of road. MoneyGeek’s analysis included 1,538 of these roads.

MoneyGeek also looked into other factors, including drunk driving, speeding, distracted driving, time of year and winter, and determined how each of them contributes to accident fatalities in New York.

Data for each county in the state were summarized, including the deadliest road in each county.

Key Findings

  • In New York City, distracted driving is associated with more fatal accidents than drunk driving or speeding.
  • About 20% of fatal accidents were related to drunk driving. These accounted for 549 of the 2,725 total fatal accidents in the state.
  • Speeding contributed to 28% of accidents statewide. That’s 756 fatal accidents from 2017–2019.
  • September typically has the most fatal accidents. Despite having the sixth-highest count of winter driving fatalities in the nation — the summer months are New York’s deadliest for driving.

10 Deadliest Road Stretches in New York


  • DEADLIEST ROAD IN NEW YORK
    3rd Ave. from 7th St. to 52nd St.
    Brooklyn | New York City
    3rd Ave. from 7th St. to 52nd St.
    • Fatal Accidents:8
    • fatalities:8
    • Crashes Per Mile:3.6
    • distance:2.2
  • Atlantic Ave from Rochester Ave. to 85th St.
    Brooklyn | New York City | Queens
    Atlantic Ave from Rochester Ave. to 85th St.
    • Fatal Accidents:7
    • fatalities:7
    • Crashes Per Mile:1.9
    • distance:3.8
  • CR-93 from Richmond Blvd. to 13th St.
    Islip | Bohemia
    CR-93 from Richmond Blvd. to 13th St.
    • Fatal Accidents:7
    • fatalities:7
    • Crashes Per Mile:1.5
    • distance:4.8
  • Lake Ave. from Denise Rd. to Phelps Ave.
    Rochester
    Lake Ave. from Denise Rd. to Phelps Ave.
    • Fatal Accidents:6
    • fatalities:7
    • Crashes Per Mile:1.2
    • distance:4.9
  • SR-27 from Albany Ave. to Harvard Rd.
    Babylon
    SR-27 from Albany Ave. to Harvard Rd.
    • Fatal Accidents:6
    • fatalities:6
    • Crashes Per Mile:1.3
    • distance:4.6
  • Bruckner Blvd. from Balcom Ave. to Jackson Ave.
    New York City | Bronx
    Bruckner Blvd. from Balcom Ave. to Jackson Ave.
    • Fatal Accidents:6
    • fatalities:6
    • Crashes Per Mile:1.3
    • distance:4.5
  • Woodhaven Blvd. from 91st Ave. to Dry Harbor Rd.
    Middle Village | Queens
    Woodhaven Blvd. from 91st Ave. to Dry Harbor Rd.
    • Fatal Accidents:6
    • fatalities:6
    • Crashes Per Mile:2.1
    • distance:2.9
  • Northern Blvd from 70th St. to Main St.
    Queens
    Northern Blvd from 70th St. to Main St.
    • Fatal Accidents:5
    • fatalities:7
    • Crashes Per Mile:1.5
    • distance:3.4
  • Flatbush Ave. from Avenue V to Midwood St.
    Brooklyn | New York City
    Flatbush Ave. from Avenue V to Midwood St.
    • Fatal Accidents:5
    • fatalities:6
    • Crashes Per Mile:1.2
    • distance:4.1
  • S.Conduit Ave from Sutter Ave. to Rockaway Blvd.
    Middle Village | Queens
    S.Conduit Ave from Sutter Ave. to Rockaway Blvd.
    • Fatal Accidents:5
    • fatalities:6
    • Crashes Per Mile:1.2
    • distance:4.1

Drunk Driving Involved in 20% of Fatal Accidents

Drunk driving contributed to 20% of fatal accidents in New York from 2017 to 2019. Of the total 2,725 deadly crashes during this three-year period, 549 were related to drunk driving.

Based on the number of incidences, drunk driving outnumbered the total fatal accidents involving distracted driving and winter weather.

Alcohol affects your driving abilities. Even a small amount can put you and others at harm. According to New York law, drivers are considered legally intoxicated if they have 0.08% blood alcohol concentration (BAC). That said, even a 0.02% BAC can make you visibly impaired.

Drunk driving does not always lead to fatal accidents. However, the costs of drunk driving can be extensive and long-lasting. Among the consequences are license suspension, restricted driving privileges, possible jail time and less affordable car insurance in New York.

Speeding Is a Factor in 28% of Fatal Crashes

From 2017 to 2019, there were 756 deadly accidents in New York due to speeding — that’s 28% of all total fatal crashes in the state.

Speeding is dangerous. Drivers can lose control of the car, which makes it harder to quickly stop if needed. Thus, increasing the chances of severe injuries or, worse — fatal accidents.

Distracted Driving Contributed to 13% of Fatal Accidents

New York recorded 360 fatal crashes involving distracted driving from 2017 to 2019. That means distracted driving contributed to 13% of total deadly accidents in the state.

While New York has lower distracted driving rates than many states, it certainly isn’t among the best. According to a study conducted by MoneyGeek, New York ranked as the 17th worst state for distracted driving.

September Had More Fatal Accidents Than Any Other Month

New York saw the highest number of fatal accidents in September. There were 300 deadly crashes during the month, which accounted for 10.7% of the total crashes.

Even though MoneyGeek’s most dangerous states for winter driving study found that New York is the sixth-worst state for winter driving fatalities in the nation, most accidents in the state occurred during the summer. August and July recorded the second and third highest numbers of deadly accidents.

Driving Safely Protects You, Others and Your Wallet

Driving safely not only helps make New York roadways safer and reduces the risk of injuring others, but it also allows you to save money in the long run. The state requires all drivers to maintain auto insurance, which could help protect your finances if you get into an accident. For maximum coverage, MoneyGeek recommends finding an affordable full coverage auto insurance policy.

The average cost of auto insurance in New York is $3,433 per year. That said, actual rates may vary greatly depending on where you live. For instance, auto insurance in Rochester costs $1,166 per year on average. A similar auto insurance policy in New York City, which has the largest population in the state, costs an average of $4,103 per year. That’s a difference of $2,937 annually between the two cities.

However, it’s important to keep in mind that these rates are only averages. Your car insurance premiums may be different depending on individualized factors, such as age and driving history. The best way to find the cheapest car insurance company is to shop around and compare personalized quotes from multiple providers.

Fatal Accidents and Most Dangerous Roads: County Breakdown

The top five counties with the most fatal accidents in New York from 2017 to 2019 recorded a total of 1,100 incidents — that’s nearly 40% of the total deadly crashes that occurred in the state.

Based on the number of fatal crashes, the deadliest county for driving in New York is Suffolk. There were 346 fatal accidents in Suffolk from 2017 to 2019. More of these crashes occurred on SR-25 than any other road in the county. Speeding (87) and drunk driving (78) were the most significant contributing factors involved.

Methodology

MoneyGeek analyzed data from the National Highway Traffic Safety Administration FARS (fatal accident reporting system) database using fatality data from 2017, 2018 and 2019. Currently, 2019 is the latest data available in the system.

About Doug Milnes, CFA


Doug Milnes, CFA headshot

Doug Milnes is a CFA charter holder with over 10 years of experience in corporate finance and the Head of Credit Cards at MoneyGeek. Formerly, he performed valuations for Duff and Phelps and financial planning and analysis for various companies. His analysis has been cited by U.S. News and World Report, The Hill, the Los Angeles Times, The New York Times and many other outlets.

Milnes holds a master’s degree in data science from Northwestern University. He geeks out on helping people feel on top of their credit card use, from managing debt to optimizing rewards.


sources