Emissions on the Road: Environmental Impact of Automobiles and the Benefits of Going Green


Updated: September 4, 2026

Advertising & Editorial Disclosure

Vehicles affect the environment. The Environmental Protection Agency (EPA) reports that transportation activities produced 29% of U.S. greenhouse gas emissions in 2021. These emissions cause air pollution, climate change and global warming, issues that affect your health and finances.

The financial impacts show up in your bills for food, utilities, gas, health care and insurance. Extreme weather events can cost you income or even your home. Climate change demands more responsible choices about the vehicles we use.

Your driving habits contribute to global warming. Environmentally friendly vehicles produce fewer emissions and often cost less to insure.


Vehicles and Global Warming Statistics

Vehicle emissions are among the largest contributors to greenhouse gas emissions in the country. The impact of climate change poses environmental, economic and financial risks.

FastFact.png
Fast fact icon

The U.S. recorded a total of 5.6 billion metric tons of carbon dioxide (CO2) equivalent in net greenhouse gas emissions in 2021. Transportation was 29% of total emissions.

Fast fact icon

In the U.S., about 79% of total emissions are from CO2. The average passenger vehicle emits 4.6 metric tons of CO2 a year.

Fast fact icon

Aside from CO2, motor vehicles emit other greenhouse gases like methane and nitrous oxide. In the U.S., methane contributed 12% of emissions and nitrous oxide accounted for 6%.

Fast fact icon

Since 2010, we've seen the 10 warmest years on record, nine of which occurred between 2014 and 2022. Countries across the globe continue to record higher-than-average temperatures and weather anomalies.

Fast fact icon

Climate change poses an economic threat in terms of agricultural productivity, energy use and demand, labor supply, mortality and storm activity. Severe heat waves, coastal flooding and other weather disasters cost the country more than $165 billion in 2022.

Fast fact icon

On a personal level, climate change heightens financial risks in real estate, insurance, asset values, investments and cash flows.

How Much Greenhouse Gas Is Released by Vehicles?

Greenhouse gas emissions, including carbon dioxide (CO2), methane (CH4) and nitrous oxide (N2O), harm the environment. In the U.S., transportation activities account for the most emissions at 29%. According to the EPA, the average passenger vehicle emits 4.6 metric tons of CO2 per year.

Net emissions rose 6% over 2021, largely because of increased economic activity after the COVID-19 pandemic slowdown. Transportation sector emissions grew 19% from 1990 to 2021.

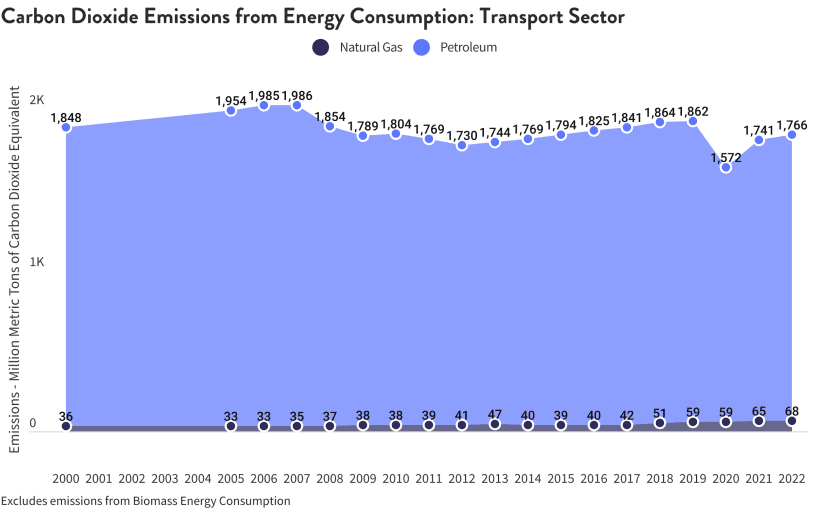
Carbon dioxide emissions from energy consumption fluctuate as consumption levels change. Petroleum remains the highest contributor to CO2 emissions in the transportation sector. Natural gas emissions are much lower but have grown steadily.

Sources of CO2 Emissions in the Transportation Sector

CO₂ emissions from transport energy use, 2000–2022, showing petroleum dominance and slight rise post-2020.

Greenhouse Gas Emissions by Sector

In 2021, the transportation industry had the highest greenhouse gas emissions in the country among all economic sectors, up 18.6% since 1990. Emissions rose year-over-year through 2019, then dropped during the COVID-19 pandemic slowdown in 2020. The 2021 total was slightly lower than the 2016–2019 numbers but trended upward. Greenhouse gas emissions in the transportation sector peaked in 2007 at 1,967.25 million metric tons of carbon dioxide equivalent.

Transportation Contributes the Most Greenhouse Gas Emissions in 2021

 Stacked chart of U.S. CO₂ emissions by sector from 1990–2021, with transportation as the top emitter.

Transportation CO2 Emissions by State

In 2020, Texas recorded the highest energy-related CO2 emissions in the U.S., with 624 million metric tons, including 192.7 million metric tons from transportation. Vermont had the lowest total CO2 emissions, recording only 5.6 million metric tons, with transportation-related emissions accounting for 2.9 million metric tons.

Emissions Across Vehicle Types

Vehicles are among the largest contributors to greenhouse gas emissions, but not all vehicles emit the same amount. Factors such as engine technology, fuel type, usage patterns and vehicle size all affect emissions. Among on-road vehicles, light-duty trucks had the highest greenhouse gas emissions in 2021 at 671.8 million metric tons of CO2 equivalent. They were followed by medium-duty and heavy-duty trucks (417.1 million metric tons), passenger cars (374.2 million metric tons), buses (25.7 million metric tons) and motorcycles (7.5 million metric tons).

Passenger cars

These include light-duty vehicles with a maximum gross vehicle weight rating (GVWR) of less than 8,500 lbs. and medium-duty vehicles (8,501 to 10,000 lbs.). The EPA considers a vehicle a passenger car if it's primarily used for transporting 12 people or fewer. In 2021, passenger cars recorded the third-highest greenhouse gas emissions among on-road vehicles at 374.2 million metric tons. Beyond vehicle type, emissions vary by fuel type.

The Bureau of Transportation Statistics (BTS) breaks down light-duty vehicle emission rates by fuel type.

Estimated Average Emission Rate (Grams per mile)
Gasoline
Diesel

Total hydrocarbons (HC)

0.280

0.143

Exhaust carbon monoxide (CO)

4.152

3.640

Exhaust nitrogen oxides (NOx)

0.192

0.129

Exhaust particulate matter with diameter <= 2.5 micrometers (PM2.5)

0.004

0.002

Brake wear PM2.5

0.003

0.003

Light-duty trucks

Light-duty trucks, including SUVs and minivans, haul passengers and cargo. In 2021, they produced 671.8 million metric tons of CO2 equivalent emissions and logged more than 1,492,200 million miles nationwide.

Gasoline-fueled light-duty trucks emit at higher rates than diesel models in most pollutant categories.

Estimated Average Emission Rate (Grams per mile)
Gasoline
Diesel

Total HC

0.339

0.308

Exhaust CO

5.422

2.458

Exhaust NOx

0.376

1.804

Exhaust PM2.5

0.007

0.078

Brake wear PM2.5

0.003

0.003

Medium-duty and heavy-duty trucks

Medium-duty and heavy-duty trucks produced 417.1 million metric tons of CO2 equivalent in 2021, the second-largest share among on-road vehicles. These vehicles traveled 317,245 million miles that year. This category includes single-unit trucks, combination trucks, tractor-trailers and box trucks used for freight transportation, plus service and utility trucks.

Gasoline-fueled heavy-duty vehicles produce higher HC and CO emission rates, while diesel-fueled trucks produce more NOx and PM2.5.

Estimated Average Emission Rate (Grams per mile)
Gasoline
Diesel

Total HC

1.161

0.269

Exhaust CO

14.894

2.000

Exhaust NOx

0.875

4.169

Exhaust PM2.5

0.026

0.106

Brake wear PM2.5

0.006

0.009

Buses

Buses were the fourth-highest contributor to greenhouse gas emissions. They totaled 25.7 million metric tons of CO2 equivalent or 1.3% of all emissions. Bus emissions break down as 25.1 million metric tons of CO2, 0.2 million metric tons of nitrous oxide and 0.4 million metric tons of hydrofluorocarbons (HFC).

Motorcycles

Motorcycles had the lowest greenhouse gas emissions among on-road vehicles. In 2021, motorcycles totaled 7.5 million metric tons of CO2 equivalent. The EPA reports these average emission rates for motorcycles:

Estimated Average Emission Rate (Grams per mile)
Gasoline

Total HC

2.624

Exhaust CO

13.411

Exhaust NOx

0.642

Exhaust PM2.5

0.021

Brake wear PM2.5

0.002

 Illustration of three cars in a city with a person driving a black car in the foreground.

Far-Reaching Impacts of Automobile Emissions

2022 ranked as the world's sixth-warmest year on record since 1880. Ten of the warmest years on record have occurred since 2010. During this period, the world has seen rising seas and prolonged droughts. Flooding has grown more severe, too. Long-term temperature changes result from global warming caused by greenhouse gas emissions. Motor vehicles are among the country's highest-emitting sources. In the U.S., the transportation industry has the highest impact among all economic sectors.

The effects of car emissions extend beyond weather-related events. Climate change affects personal finances and public health alike. As extreme weather events become more frequent, home values can drop, and utility and insurance costs climb.

  • windstorm icon

    Air pollution

    Burning fossil fuels, including the gasoline and diesel that power cars, releases pollutants such as particulate matter (PM) and volatile organic compounds (VOCs) into the air. Vehicle emissions also cause greenhouse gases like CO2, NOx, CH4, N2O and HFC to build up. These gases worsen air quality and warm Earth's atmosphere.

  • hospital icon

    Health impacts

    Exposure to pollutants like PM, VOCs and greenhouse gases can harm respiratory and cardiovascular health. Long-term exposure has also been linked to increased cancer risk.

  • flood icon

    Environmental degradation

    Pollution from vehicle emissions also spreads to soil and water. Greenhouse gases deplete the ozone layer and reduce Earth's protection against ultraviolet radiation. When greenhouse gases mix with rainwater, they create acid rain that harms plants and wildlife. Oil spills from vehicles penetrate the soil, and PM from emissions contaminates bodies of water.

  • hearingLoss icon

    Noise pollution

    Humans and wildlife may develop health issues from vehicle noise pollution. Regular exposure can disrupt sleep and cause chronic stress. Over time, it has also been linked to a higher risk of heart disease.

  • bankruptcy icon

    Economic costs

    Economic implications of vehicle emissions include higher health care costs due to pollution-related diseases, additional expenses for infrastructure maintenance, material losses from extreme weather events, higher utility bills and increases in home insurance premiums.

 Cars parked in a city with trees and a woman standing nearby in a minimalist illustration.

Driving Green: How to Reduce Emissions

Passenger vehicles are among the largest sources of greenhouse gas emissions and a leading driver of global warming. This isn't exclusive to the U.S. The transportation sector contributes 16.2% of all greenhouse gas emissions globally. Of these, 11.9% are from on-road vehicles.

Drivers cut emissions by choosing fuel-efficient vehicles and driving less. Unnecessary idling adds to the problem, too. The result: cleaner air and less dependence on fossil fuels. The United Nations includes sustainable transport in the Sustainable Development Goals under the Paris Agreement on Climate Change.

Car owners can take these steps to reduce their carbon footprints:

  • car icon

    Regular vehicle maintenance

    A well-maintained car runs more efficiently and burns less fuel. Schedule regular tune-ups and follow your manufacturer's maintenance schedule. Use recommended products, including the right grade of motor oil.

  • gauge icon

    Eco-friendly driving practices

    Driving habits affect emissions just as much as the engine under the hood. Go easy on the gas pedal and brakes. Skip unnecessary idling, which creates air pollution and accelerates engine wear. Watch your temperature gauge and use the A/C sparingly.

  • boyThinking icon

    Alternative transportation options

    Not every trip requires a car. Walk or bike for short distances. For longer commutes, take public transit or carpool with coworkers or friends.

  • carColored icon

    Low-emission vehicle choices

    If you're shopping for a new vehicle, look for low-emission options: EVs, plug-in hybrids, hydrogen fuel cell vehicles and cleaner-burning gas models. These choices cut emissions and reduce your fuel costs over time.

  • worldGlobe icon

    Community awareness and advocacy

    Small acts of advocacy add up. Share public service campaigns and educational resources from government agencies and nonprofits to encourage greener driving choices.

CARBON FOOTPRINT CALCULATORS

A carbon footprint calculator can help you see the scale of your emissions across home energy, waste and transportation.

You can visit the EPA's Carbon Footprint Calculator and enter your ZIP code and the number of people in your household to get a quick estimate. You can also download a spreadsheet version to see how emissions are calculated. Another option is The Nature Conservancy's online interactive tool.

Reducing Your Carbon Footprint With Green Auto Insurance

Auto insurance provides financial protection against unexpected incidents, though that coverage can come at a high price depending on the policy. Many auto insurance providers offer green or eco-friendly auto insurance that rewards green efforts with discounts. Green car insurance may also refer to programs that allow you to pay premiums based on how much you drive.

Benefits of Green Auto Insurance

Green auto insurance rewards drivers who make lower-emission choices. Insurers offer specialized coverage for hybrids and electric cars, with higher limits for replacement parts and repairs. Some plans cover batteries and charging cables; others include incentive programs that reduce your premium.

Usage-Based Auto Insurance

Some insurance companies offer green auto insurance through usage-based policies. You pay based on how much you drive: the fewer miles you log, the lower your premium. These programs also reward smooth driving habits, like gradual braking and avoiding peak-hour traffic, which help cut emissions.

Pay-as-you-drive programs add a mileage-tracking device to your vehicle. You earn policy discounts when you drive fewer miles than average.

Additional Incentives for Sustainable Driving

Insurance companies reward eco-friendly transportation choices beyond pay-as-you-drive programs and specialized coverage.

  • discount icon

    Green vehicle premium discounts

    A hybrid or EV can lower your auto insurance costs.

  • pickupTruck icon

    Alternative fuel premium discounts

    Some insurers offer discounts to drivers using alternative energy sources like biodiesel, natural gas, hydrogen, ethanol or electricity.

  • carAccident icon

    Green vehicle replacement

    If your gas-powered vehicle gets totaled and you replace it with an electric or hybrid car, green vehicle replacement coverage pays the difference.

  • carColored icon

    Paperless discount

    Paperless billing can also lower your premium. Many insurers offer this discount.

 Woman charging an electric car at a station in a modern, clean environment.

Green Wheels: How to Choose an Environmentally-Friendly Vehicle

Today's eco-friendly vehicles run on alternative energy or burn fuel more efficiently than conventional models. They emit fewer greenhouse gases and cost less to fuel. These six factors can guide your choice.

  1. 1
    Size and weight

    Lighter vehicles have better aerodynamics and higher fuel efficiency. Before settling on a model, consider how much cargo and how many passengers you'll regularly carry.

  2. 2
    Personal needs and preferences

    Factor in your commute and daily driving habits. Research vehicle classes and models to find one that fits your routine.

  3. 3
    Safety features

    Look for driver assistance technology like forward collision warnings, blind spot monitoring and automatic emergency braking. Pre-tensioner seat belts are also worth checking; they lock on impact to reduce injury.

  4. 4
    Fuel efficiency and emissions

    Check what alternative fuels are available near you, including biodiesel, which cuts greenhouse gas emissions. If charging stations are easy to find in your area, an EV is worth considering. Hybrids let you switch between gas and electricity.

  5. 5
    Vehicle lifespan and maintenance

    Gas-powered cars need more frequent maintenance than EVs, though EVs require battery replacements after several years. Budget for long-term upkeep, not just the purchase price.

  6. 6
    Financial considerations

    Set a budget before you start comparing cars. A clear price range upfront keeps your search focused.

Expert Insight on Vehicles and Climate Change

The decision to go green requires commitment. MoneyGeek asked a few industry experts to explain the connection between vehicles and climate change.

Loading...

Additional Resources

These resources cover how cars affect the environment and what you can do to lower your impact:

About Nathan Paulus


Nathan Paulus, Head of Content and SEO, MoneyGeek

Nathan Paulus is the Senior Director of Content and SEO at MoneyGeek, where he leads content strategy and conducts original data research across insurance, consumer costs, transportation safety, housing, public policy and personal finance. He reviews studies for methodology, source quality and factual accuracy.

Research and Analysis

In more than six years at MoneyGeek, Nathan has published more than 100 original studies and explanatory guides. His insurance research includes 50-state comparisons of health care outcomes, costs and access, and an analysis of how uninsured rates track with state Medicaid expansion decisions and electoral patterns

He has analyzed full-coverage auto rates across major insurers in all 50 states and tracked how premium trends relate to industry underwriting losses. That research draws on combined ratio data from Fitch Ratings and AM Best, plus the Bureau of Labor Statistics CPI figures. Beyond insurance, his work spans vehicle pricing trends across the U.S. new car market, summer traffic fatality rates by state, homeowner underinsurance ratios using mortgage and policy data, and housing affordability across all 50 states.

His research has been cited by Bloomberg, the Los Angeles Times, Forbes, Fast Company, the San Francisco Chronicle, USA Today and NBC Los Angeles. Harvard, MIT, Stanford and Yale have referenced his work.

Career

Nathan traces his interest in personal finance back to his grandmother, who ran her household on a simple rule: spend less than you make and save the difference before anything else. That rule shows up in his work today. His writing skips jargon and complex strategy in favor of the basics that help someone living paycheck to paycheck.

He joined MoneyGeek in July 2020 as Director of Content Marketing, where he led the content team and oversaw data journalism production across insurance and personal finance verticals. A promotion to Head of Marketing and Communications followed in December 2023. The new role added digital PR and communications strategy to his responsibilities. He was appointed Head of Content and SEO in January 2025.

Before MoneyGeek, Nathan served as Director of Content Marketing and SEO at Ventrix Advertising, where he helped build two content sites from scratch, contributed to link-building programs that generated more than 1,500 unique referring domains within a year and co-managed a marketing team of more than 20 people. Two and a half years at ABUV Media preceded that role. He advanced from Marketing Research Analyst to Senior Marketing Tactics Analyst, where he built expertise in audience research, content strategy and SEO.


Sources