


- I-15 Between Exit 138 and Exit 129 is California’s deadliest stretch of road. This road is located in Hesperia, a city 35 miles north of downtown San Bernardino.
- The Los Angeles metro area has over double the population of the San Francisco metro area, but fewer of the state’s roads with the most deadly accidents. The San Francisco metro area was home to the second and third-most dangerous road stretches in the state.
- 27% of fatal accidents were related to drunk driving. In contrast, crashes on the deadliest road accounted for .1% of accidents in the state.
- Speeding contributed to 28% of accidents. That's slightly higher than the percentage of accidents that involved drunk driving.
- Distracted driving was involved in 4% of accidents. Compared to other states, California has low rates of distracted driving. A study conducted by MoneyGeek ranked them better than 92% of states.
- The month of November had the most fatal accidents. High rates of crashes during this time are likely due to Halloween and Thanksgiving-related travel.
- Los Angeles County had more deadly accidents than any other county. Speeding and drunk driving contributed most to fatal accidents there.
Where Are California’s Deadliest Roads, and What Factors Contribute Most to its Fatal Accidents?
Updated: May 8, 2026
Advertising & Editorial Disclosure

MoneyGeek analyzed the most recent data available from the National Highway Traffic Safety Administration to find the deadliest roads in California, the nation’s most populous state. Of California’s 396,540 miles of road, MoneyGeek analyzed 4,452 roads.
The study looked at 10,370 fatal car accidents recorded from 2017 to 2019 and examined how factors like drunk driving, speeding distracted driving and time of year contributed to fatal crashes in the state. MoneyGeek also summarized data for each county in California, including the deadliest road in each county.
Key Findings:
10 Deadliest Road Stretches in California
I-15 Between Exit 138 and Exit 129
Hesperia

Fatal Accidents: 19
Fatalities: 19
Fatal Accidents Per Mile: 4.2
Distance: 4.5 miles
I-80 Between Exit 14A and Exit 8A
Berkeley | Oakland | Emeryville | Albany

Fatal Accidents: 15
Fatalities: 17
Fatal Accidents Per Mile: 3
Distance: 5 miles
I-80 from Exit 15 to Exit 21
Richmond | El Cerrito | Pinole | San Pablo

Fatal Accidents: 13
Fatalities: 18
Fatal Accidents Per Mile: 2.6
Distance: 5 miles
I-5 from Del Paso Rd. to Railyards Blvd.
Sacramento
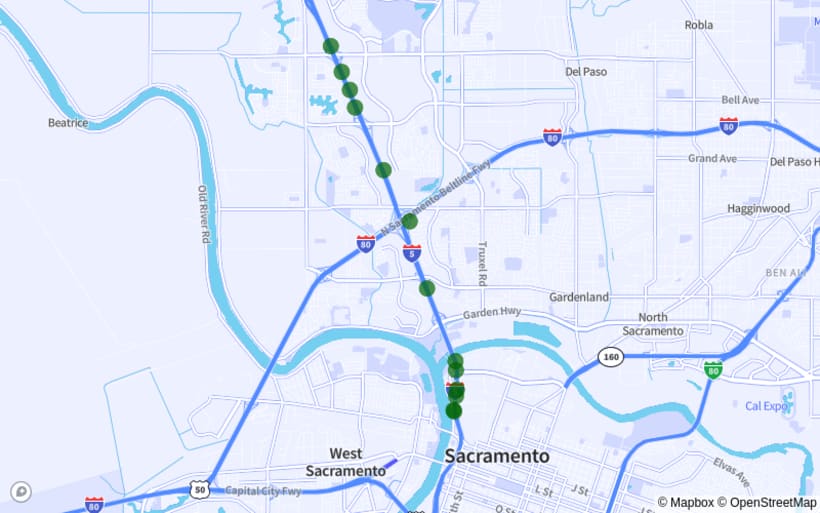
Fatal Accidents: 13
Fatalities: 16
Fatal Accidents Per Mile: 2.6
Distance: 4.9 miles
I-215 from Exit 44B to Exit 39
Colton | San Bernardino

Fatal Accidents: 13
Fatalities: 13
Fatal Accidents Per Mile: 2.7
Distance: 4.7 miles
SR-74 Between Melba Avenue and 3rd St.
Menifee

Fatal Accidents: 11
Fatalities: 12
Fatal Accidents Per Mile: 2.7
Distance: 4.1 miles
I-605 from Exit 5B to Firestone Blvd.
Norwalk | Cerritos
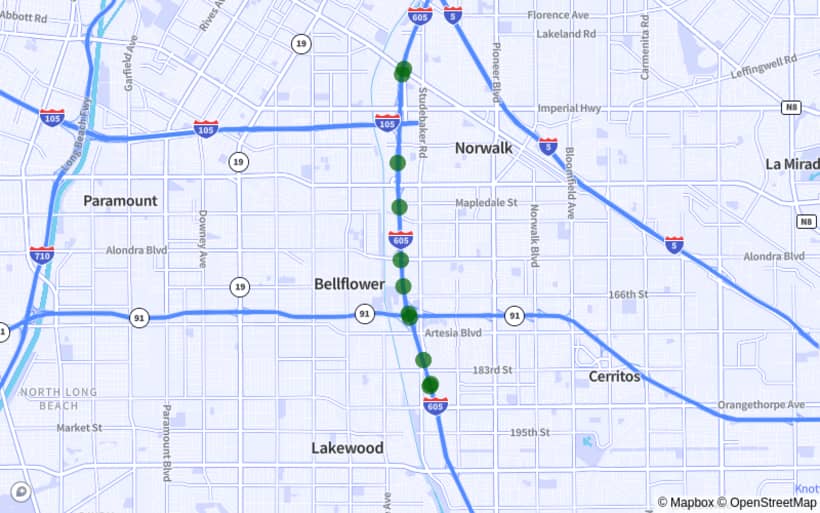
Fatal Accidents: 11
Fatalities: 12
Fatal Accidents Per Mile: 2.6
Distance: 4.3 miles
I-280 from Meridian Ave. to McLaughlin Ave.
San Jose
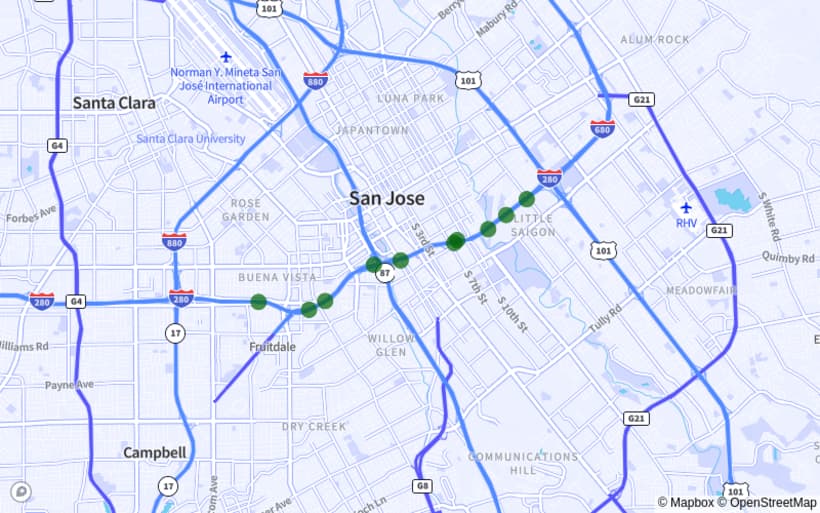
Fatal Accidents: 10
Fatalities: 10
Fatal Accidents Per Mile: 2.7
Distance: 3.7 miles
Bear Valley Rd. Between Navajo Rd. and Tamarski Rd.
Apple Valley | Hesperia

Fatal Accidents: 10
Fatalities: 13
Fatal Accidents Per Mile: 2.1
Distance: 4.7 miles
SR-22 from Exit 10 to Exit 5
Garden Grove
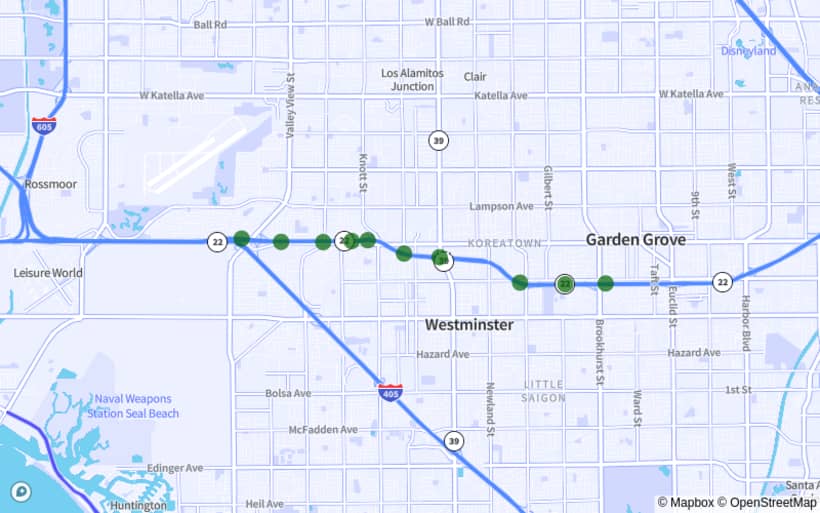
Fatal Accidents: 10
Fatalities: 13
Fatal Accidents Per Mile: 2
Distance: 5 miles
Deadliest Roads in California by Metro
California is home to some of the most recognizable metropolitan areas in the country. MoneyGeek broke down the deadliest roads in each of the state’s largest metros — Los Angeles, San Francisco and San Diego — to compare fatal accidents in each.
Los Angeles Metro
Approximately 13,214,799 people live in the Los Angeles metro area. It's one of the most population-dense metros in the country and was ranked as the fourth-most congested urban area in the United States in the 2021 Urban Mobility report. Given the size of this metropolitan area, it’s surprising that its deadliest road stretches are only the state’s seventh, 10th and 13th most dangerous.
The table below shows the number of fatal accidents recorded for each route found in the Los Angeles Metro.
Los Angeles Metro’s Deadliest Roads
Road Ranking | Route Description | Cities | Fatal Accidents |
|---|---|---|---|
7 | I-605 from Exit 5B to Firestone Blvd. | Norwalk | Cerritos | 11 |
10 | SR-22 from Exit 10 to Exit 5 | Garden Grove | 10 |
13 | I-5 from Exit 111 to 116 | Anaheim | Fullerton | Buena Park | 10 |
San Francisco Metro
As of 2019, the total population of the San Francisco metro area was 4,731,803. This metro area is tied with Los Angeles as the fourth-most congested urban area in the United States. Unlike the Los Angeles metro, the San Francisco metro contains two of the state’s three most dangerous roads for fatal accidents.
The table below breaks down the stretches and cities with the three highest numbers of fatal accidents in the San Francisco Metro.
San Francisco Metro’s Deadliest Roads
Road Ranking | Route Description | Cities | Fatal Accidents |
|---|---|---|---|
2 | I-80 Between Exit 14A and Exit 8A | Berkeley | Oakland | Emeryville | Albany | 15 |
3 | I-80 from Exit 15 to Exit 21 | Richmond | El Cerrito | Pinole | San Pablo | 13 |
33 | I-880 from Exit 31 to Exit 36 | Oakland | San Leandro | 9 |
San Diego Metro
As of 2019, 3,338,330 people lived in the San Diego-Chula Vista-Carlsbad metro area. The table below shows the cities and the total number of fatal accidents in the three deadliest stretches of road in the San Diego Metro.
San Diego Metro’s Deadliest Roads
Road Ranking | Route Description | Cities | Fatal Accidents |
|---|---|---|---|
12 | I-15 from Exit 13 (Miramar Way) to Exit 17 | San Diego | 10 |
17 | I-5 from Exit 2 to Exit 7B | San Diego | Chula Vista | 10 |
18 | I-5 from Exit 17 A to Exit 11A | San Diego | National City | 10 |
Drunk Driving Involved in 27% of Fatal Accidents
Around 27% of the total number of fatal accidents in California involved drunk driving. That means that drunk driving contributed to 2,802 of the 10,370 deadly crashes in the state.
Even a small amount of alcohol can affect your driving abilities and put you and others at harm. California laws consider a driver with a blood alcohol concentration (BAC) of 0.08% as legally intoxicated — but even a 0.02% BAC can cause visual impairment and make driving dangerous.
Even if you aren’t involved in a fatal accident, the costs of drunk driving can be extensive and long-lasting. It could result in license suspension, restricted driving privileges and possible jail time. It will almost certainly lead to less affordable car insurance in California.
Additionally, you need SR-22 insurance in California after a DUI. This type of coverage is significantly more expensive than other insurance policies.
Speeding Is a Factor in 28% of Fatal Crashes
Speeding is among the factors that contributed to fatal crashes from 2017 to 2019 in California, with a total of 2,923 incidents. This makes up 28% of the total deadly accidents in the state — outnumbering even drunk driving-related deaths.
There are many dangers to speeding. Going beyond speed limits can cause you to lose control of your car, making it harder to stop immediately if necessary. It also increases the chance of fatal crashes and severe injuries.
Speeding is also costly — particularly in California. While the base price of a ticket in California is fairly low, the state has multiple add-on fees that can raise costs by hundreds of dollars. Case in point — the average red-light ticket in the state is $490 — nearly three times the national average.
Distracted Driving Contributed to 4% of Fatal Accidents
During the three-year period surveyed, California recorded 447 fatal accidents involving distracted driving. That’s 4% of the total number of deadly crashes in the state.
Among all states, California ranked as the 47th-worst state for distracted driving. Based on MoneyGeek’s analysis, California is better than 92% of states for distracted driving.
November Had More Fatal Accidents Than Any Other Month
The state saw the highest number of fatal accidents in November compared to any other month. There were 951 deadly crashes recorded during the month, which is 9.2% of the total. Congestion on California roads due to Halloween and Thanksgiving-related travel likely contributes to the fatal accidents in this month.
September and October had the second and third highest numbers of fatal accidents.
Average Fatal Accidents by Month: 2017–2019
Month | Fatal
Accidents | Drunk
Driving
Related | Distracted
Driving
Related | Winter
Conditions | Speeding
Related | % of
Total |
|---|---|---|---|---|---|---|
January | 864 | 213 | 34 | 6 | 221 | 8.2% |
February | 740 | 190 | 34 | 3 | 206 | 7.2% |
March | 822 | 228 | 38 | 4 | 259 | 7.9% |
April | 787 | 205 | 35 | 0 | 233 | 7.6% |
May | 860 | 256 | 23 | 0 | 253 | 8.3% |
June | 877 | 255 | 30 | 0 | 249 | 8.5% |
July | 884 | 284 | 38 | 0 | 263 | 8.7% |
August | 892 | 227 | 36 | 0 | 245 | 8.6% |
September | 911 | 250 | 47 | 1 | 252 | 8.7% |
October | 893 | 222 | 50 | 0 | 235 | 8.7% |
November | 951 | 232 | 37 | 1 | 265 | 9.2% |
December | 889 | 240 | 45 | 3 | 242 | 8.5% |
Driving Safely Protects You, Others and Your Wallet
Being a safe driver not only ensures your safety but also helps make California roadways safer. However, even the best driving habits can’t always prevent an accident.
Having auto insurance while driving on the roads of California is essential. If you are looking for maximum coverage, choosing an affordable full coverage car insurance policy can financially protect you and your loved ones after a crash.
The average cost of full coverage car insurance in California is $1,429 per year. Actual prices can vary dramatically depending on where you live in the state. For instance, the average annual rate for auto insurance in Glendale is $2,283. Meanwhile, car insurance in Chula Vista costs an average of $1,205 per year. That is a difference of $1,078 per year. The average cost of auto insurance in Los Angeles — the city with the largest population in the state — is $1,916 annually.
These rates are only averages. Car insurance premium rates depending on individualized factors, including your age and driving history. To find the best and cheapest auto insurance company, shop around and compare quotes from multiple providers.
Fatal Accidents and Most Dangerous Roads: County Breakdown
The top five counties with the most fatal accidents in California had a total of 5,017 recorded incidents from 2017–2019. That means around 47% of the 10,370 recorded fatal crashes in the state happened in these counties.
Los Angeles County — the largest county in the country — had the most fatal accidents in the state. Interestingly, the county didn't contain many of the segments of road that had the most fatal accidents but still had the most deadly crashes overall.
There were 2,047 fatal crashes in Los Angeles County from 2017 to 2019. I-5 had the most deadly accidents in the county — speeding (648) and drunk driving (450) were the most common contributing factors.
Fatal Accidents and Contributing Factors By County: 2017–2019
County | Fatalities | Fatal
Accidents | Drunk
Driving
Related | Distracted
Driving
Related | Speeding
Related | Most Deadly
Road
(Fatal Accidents) |
|---|---|---|---|---|---|---|
Los Angeles | 2169 | 2047 | 450 | 76 | 648 | I-5 (44) |
San Bernardino | 986 | 897 | 228 | 44 | 267 | I-15 (102) |
Riverside | 895 | 827 | 260 | 28 | 222 | I-10 (58) |
San Diego | 755 | 710 | 176 | 30 | 209 | I-5 (52) |
Orange | 578 | 536 | 147 | 20 | 164 | I-5 (32) |
Sacramento | 483 | 448 | 115 | 24 | 120 | I-5 (32) |
Kern | 492 | 439 | 130 | 23 | 110 | I-5 (36) |
Fresno | 414 | 367 | 98 | 13 | 99 | SR-180 (22) |
Santa Clara | 360 | 344 | 82 | 20 | 103 | US-101 (38) |
San Joaquin | 347 | 316 | 78 | 11 | 101 | I-5 (33) |
Alameda | 277 | 260 | 61 | 12 | 91 | I-880 (27) |
Stanislaus | 231 | 211 | 63 | 11 | 55 | SR-99 (20) |
Contra Costa | 220 | 201 | 61 | 8 | 55 | SR-4 (25) |
Tulare | 226 | 199 | 67 | 6 | 38 | SR-99 (15) |
Merced | 179 | 157 | 45 | 3 | 36 | SR-152 (25) |
Ventura | 154 | 140 | 51 | 8 | 42 | SR-126 (11) |
Monterey | 139 | 129 | 47 | 11 | 30 | US-101 (25) |
Solano | 131 | 123 | 39 | 7 | 25 | I-80 (27) |
Sonoma | 118 | 114 | 41 | 6 | 32 | US-101 (19) |
Butte | 109 | 101 | 30 | 4 | 22 | SR-99 (18) |
San Luis Obispo | 108 | 100 | 38 | 4 | 27 | US-101 (23) |
Santa Barbara | 114 | 96 | 25 | 2 | 24 | US-101 (24) |
Shasta | 96 | 90 | 30 | 3 | 21 | SR-273 (11) |
San Mateo | 92 | 86 | 16 | 3 | 27 | US-101 (10) |
San Francisco | 91 | 86 | 6 | 4 | 19 | US-101 (8) |
Imperial | 93 | 83 | 21 | 6 | 19 | I-8 (20) |
Mendocino | 91 | 80 | 26 | 2 | 22 | US-101 (30) |
Madera | 101 | 80 | 21 | 3 | 15 | SR-41 (12) |
El Dorado | 87 | 79 | 19 | 1 | 33 | US-50 (19) |
Placer | 81 | 78 | 23 | 3 | 23 | I-80 (16) |
Humboldt | 87 | 74 | 31 | 1 | 15 | US-101 (25) |
Yolo | 79 | 69 | 15 | 6 | 18 | I-80 (9) |
Sutter | 76 | 61 | 18 | 4 | 15 | SR-99 (24) |
Santa Cruz | 61 | 58 | 17 | 4 | 15 | SR-1 (11) |
Kings | 63 | 51 | 20 | 2 | 10 | SR-41 (13) |
Tehama | 55 | 48 | 18 | 5 | 10 | I-5 (12) |
Marin | 48 | 47 | 15 | 1 | 17 | US-101 (16) |
Napa | 47 | 45 | 13 | 3 | 9 | SR-29 (14) |
Yuba | 48 | 43 | 13 | 3 | 10 | SR-70 (8) |
Calaveras | 45 | 41 | 16 | 1 | 9 | SR-4 (8) |
Nevada | 44 | 40 | 13 | 2 | 11 | SR-20 (11) |
Lake | 42 | 39 | 11 | 4 | 7 | SR-20 (13) |
Siskiyou | 42 | 38 | 13 | 1 | 13 | I-5 (10) |
Tuolumne | 36 | 34 | 14 | 1 | 6 | SR-120 (11) |
Amador | 39 | 33 | 13 | 2 | 6 | SR-88 (13) |
San Benito | 31 | 30 | 12 | 2 | 8 | SR-25 (6) |
Colusa | 32 | 26 | 5 | 1 | 5 | I-5 (9) |
Del Norte | 27 | 23 | 6 | 1 | 8 | US-199 (9) |
Lassen | 24 | 22 | 4 | 3 | 4 | US-395 (8) |
Trinity | 22 | 21 | 8 | 0 | 4 | SR-299 (7) |
Glenn | 25 | 20 | 6 | 2 | 3 | I-5 (9) |
Inyo | 23 | 18 | 2 | 0 | 2 | US-395 (7) |
Mono | 23 | 16 | 6 | 2 | 4 | US-395 (11) |
Mariposa | 15 | 14 | 8 | 0 | 2 | SR-140 (6) |
Plumas | 15 | 13 | 7 | 0 | 5 | SR-70 (5) |
Modoc | 8 | 8 | 0 | 0 | 0 | Cr-91 (2) |
Sierra | 7 | 7 | 0 | 0 | 6 | SR-89 (4) |
Alpine | 7 | 7 | 4 | 0 | 2 | SR-88 (3) |
Methodology
MoneyGeek analyzed data from the National Highway Traffic Safety Administration FARS (fatal accident reporting system) database using fatality data from 2017, 2018 and 2019. Currently, 2019 is the latest data available in the system.
About Doug Milnes, CFA

Doug Milnes is a CFA charter holder with over 10 years of experience in corporate finance and the Head of Credit Cards at MoneyGeek. Formerly, he performed valuations for Duff and Phelps and financial planning and analysis for various companies. His analysis has been cited by U.S. News and World Report, The Hill, the Los Angeles Times, The New York Times and many other outlets.
Milnes holds a master’s degree in data science from Northwestern University. He geeks out on helping people feel on top of their credit card use, from managing debt to optimizing rewards.
Sources
- National Highway Safety Administration. "Fatal Accident and Reporting System (FARS)." Accessed November 1, 2024.
- U.S. Department of Transportation. "Highway Statistics Series." Accessed November 1, 2024.
- Texas A&M Transportation Institute. "2021 Urban Mobility Report." Accessed November 1, 2024.
- United States Census Bureau. "Los Angeles-Long Beach-Anaheim, CA Metro Area 2019: ACS 1-Year Estimates Data Profiles." Accessed November 1, 2024.
- United States Census Bureau. "San Diego-Chula Vista-Carlsbad, CA Metro Area 2019: ACS 1-Year Estimates Data Profiles." Accessed November 1, 2024.
- LA Weekly. "Why Are California's Traffic Tickets so Outrageously Priced?." Accessed November 1, 2024.