


Florida homeowners pay rates well below the national average. MoneyGeek analyzed premiums, J.D. Power satisfaction scores and coverage options from major insurers to find the best home insurance companies in Florida.
Best Homeowners Insurance Companies in Florida
Updated: May 28, 2026
Advertising & Editorial Disclosure
Florida's Top Home Insurance Companies: Key Takeaways
State Farm is the best home insurance provider in Florida with a score of 4.9 out of 5 from our review team.
Chubb, Nationwide, Allstate and Florida Peninsula rank high for homeowners insurance in Florida based on affordable rates, strong customer service and reliable coverage.
The best insurer for your home depends on your coverage needs, budget and preferred features like claims service or discount availability.
What Are the Best Home Insurance Companies in Florida?
State Farm ranks first for Florida homeowners with the state's lowest premiums and above-average customer satisfaction. Chubb, Nationwide, Allstate and Florida Peninsula complete the top five, excelling in areas like military-focused service, premium coverage quality and local agent networks.
State Farm | 4.9 | $3,727 | Most Florida homeowners |
Chubb | 4.7 | $10,821 | Coverage options |
Nationwide | 4.5 | $6,309 | Financial stability |
Allstate | 4.4 | $11,393 | Local agent network |
Florida Peninsula | 4.2 | $6,826 | Hurricane coverage |
*Our ratings consider various combinations of coverage levels, home features and homeowner details to identify the best overall options. Rankings may differ based on your profile.

State Farm
MoneyGeek Rating
4.9/ 5
5/5Affordability
4.7/5Customer Experience
4.6/5Coverage
J.D. Power Customer Satisfaction Score
657/1,000From the J.D. Power 2025 U.S. Home Insurance Study, which examines customer satisfaction based on responses from 14,511 homeowners and renters. The average score is 642/1,000.Average Annual Premium
$3,727Based on our methodology's base profile of a policy with $250K in dwelling coverage, $125K in personal property coverage and $200K in liability coverage with a $1,000 deductible

Chubb
MoneyGeek Rating
4.7/ 5
4.5/5Affordability
5/5Customer Experience
5/5Coverage
J.D. Power Customer Satisfaction Score
677/1,000From the J.D. Power 2025 U.S. Home Insurance Study, which examines customer satisfaction based on responses from 14,511 homeowners and renters. The average score is 642/1,000.Average Annual Premium
$10,821Based on our methodology's base profile of a policy with $250K in dwelling coverage, $125K in personal property coverage and $200K in liability coverage with a $1,000 deductible

Nationwide
MoneyGeek Rating
4.5/ 5
4.8/5Affordability
4.6/5Customer Experience
3.4/5Coverage
J.D. Power Customer Satisfaction Score
641/1,000From the J.D. Power 2025 U.S. Home Insurance Study, which examines customer satisfaction based on responses from 14,511 homeowners and renters. The average score is 642/1,000.Average Annual Premium
$6,309Based on our methodology's base profile of a policy with $250K in dwelling coverage, $125K in personal property coverage and $200K in liability coverage with a $1,000 deductible

Allstate
MoneyGeek Rating
4.4/ 5
4.5/5Affordability
4.3/5Customer Experience
4.3/5Coverage
J.D. Power Customer Satisfaction Score
633/1,000From the J.D. Power 2025 U.S. Home Insurance Study, which examines customer satisfaction based on responses from 14,511 homeowners and renters. The average score is 642/1,000.Average Annual Premium
$11,393Based on our methodology's base profile of a policy with $250K in dwelling coverage, $125K in personal property coverage and $200K in liability coverage with a $1,000 deductible

Florida Peninsula Insurance
MoneyGeek Rating
4.2/ 5
4.8/5Affordability
3.3/5Customer Experience
3.9/5Coverage
J.D. Power Customer Satisfaction Score
N/AFrom the J.D. Power 2025 U.S. Home Insurance Study, which examines customer satisfaction based on responses from 14,511 homeowners and renters. The average score is 642/1,000.Average Annual Premium
$6,826Based on our methodology's base profile of a policy with $250K in dwelling coverage, $125K in personal property coverage and $200K in liability coverage with a $1,000 deductible
Best Florida Home Insurance by City
State Farm is the top-rated carrier in 17 Florida cities, with annual premiums of $4,160 to $4,292 across markets from Jacksonville and Tampa to Hialeah and Miami Gardens. Chubb is top-rated in 13 cities, with premiums from $6,023 in Pensacola to $22,941 in Coral Springs and Pompano Beach. Nationwide has the best rate in Boca Raton ($5,782) and Hollywood ($5,779).
| Boca Raton | Nationwide | $5,782 |
| Brooksville | State Farm | $4,292 |
| Cape Coral | State Farm | $4,160 |
| Clearwater | Chubb | $12,239 |
| Clearwater Beach | Chubb | $12,239 |
| Coral Springs | Chubb | $22,941 |
| Fort Lauderdale | Chubb | $17,490 |
| Fort Myers | State Farm | $4,160 |
| Gainesville | State Farm | $4,292 |
| Hialeah | Chubb | $14,563 |
| Hollywood | Nationwide | $5,779 |
| Jacksonville | State Farm | $4,271 |
| Lakeland | State Farm | $4,292 |
| Lehigh Acres | State Farm | $4,160 |
| Miami | Chubb | $18,922 |
| Miami Gardens | Chubb | $14,654 |
| Naples | Chubb | $12,473 |
| Ocala | State Farm | $4,292 |
| Ocoee | State Farm | $4,292 |
| Okeechobee | State Farm | $4,160 |
| Orlando | State Farm | $4,292 |
| Oxford | State Farm | $4,292 |
| Palm Bay | State Farm | $4,160 |
| Pembroke Pines | Chubb | $9,313 |
| Pensacola | Chubb | $6,023 |
| Pompano Beach | Chubb | $22,941 |
| Port Saint Lucie | Chubb | $15,511 |
| Saint Petersburg | Chubb | $12,239 |
| Spring Hill | State Farm | $4,292 |
| Tallahassee | State Farm | $4,271 |
| Tampa | State Farm | $4,292 |
| Valrico | State Farm | $4,292 |
| West Palm Beach | Chubb | $13,220 |
Reviews of the Best Home Insurance in Florida Cities
If you're looking for coverage in a specific Florida city, explore our reviews of the best cheap home insurance options near you.
Cheapest Florida Home Insurance Companies
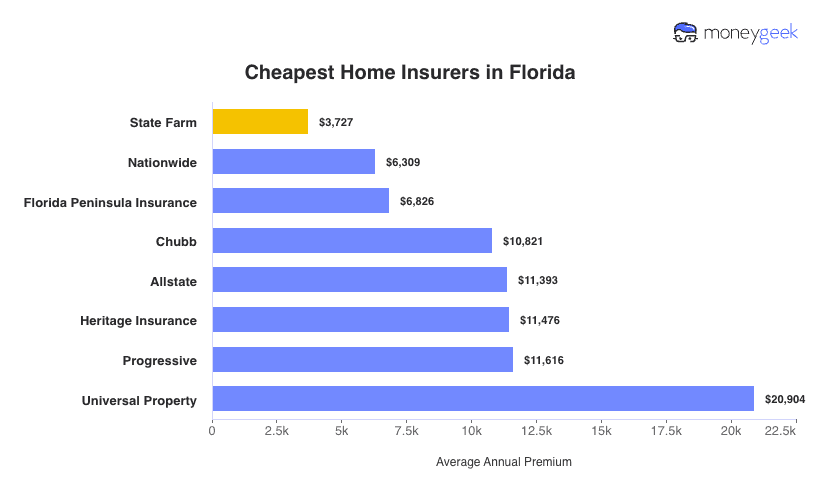
Florida homeowners pay $10,384 annually for home insurance, 200% higher than the national average of $3,467. State Farm offers the state's most affordable home insurance at $3,727 annually, 64% below the state average. Nationwide offers the second-best rates at $6,309. Costs vary among insurers. Universal Property represents the expensive end, charging 503% more than the national benchmark.
Guide to Finding the Best Florida Home Insurance Company
Choosing quality home insurance in the Sunshine State involves evaluating multiple providers based on your budget, coverage requirements and service expectations.
 Compare Quotes Strategically
Get quotes from at least three to five insurers. Premiums among top Florida providers range from $3,727 to $11,393 annually. Don't just shop by price. The cheapest policy might leave coverage gaps when you file a claim after severe weather or other covered losses.
 Check Customer Satisfaction Metrics
Review J.D. Power scores, which range from 633 to 677 among Florida's top providers compared to the 642 industry average. Check complaint ratios through the Florida Insurance and Safety Fire Commissioner's office. Read recent customer reviews focusing on claims experiences during Florida's severe weather season, not just policy shopping.
 Evaluate Coverage Needs
Consider extended or guaranteed replacement cost options since Florida's construction costs surge after hurricanes and flooding. Base your coverage on replacement cost rather than market value and review optional protections like wind/hail coverage, flood insurance and extended replacement cost that address your home's specific risks.
 Match Service Preferences to Provider Strengths
Choose insurers with local agent networks like State Farm if you want face-to-face support or digital-first insurers like USAA if you prefer online policy management. Don't pay premium prices for services you won't use.
FLORIDA HOME INSURANCE RISKS
Florida is the most hurricane-prone state in the U.S., averaging 1.5 hurricanes per year between 2018 and 2023, according to the National Hurricane Center. State law allows insurers to include hurricane deductibles in homeowners policies, calculated as 2% to 10% of your home's insured value.
Standard homeowners insurance covers hurricane wind damage but excludes flooding. You'll need separate flood coverage through your insurer or the National Flood Insurance Program.
Top-Rated Home Insurance Companies in Florida: FAQ
Explore our FAQ section for answers to common questions about selecting the right Florida home insurance provider for your needs.
Does Florida require separate hurricane deductibles for homeowners insurance?
Yes, Florida law allows insurers to include hurricane deductibles calculated as 2% to 10% of your home's insured value, separate from your standard deductible. These hurricane-specific deductibles apply when the National Hurricane Center declares a hurricane, making your out-of-pocket costs higher during named storms.
Does home insurance cover damage from fallen trees in Florida?
Home insurance covers damage to your house from fallen trees when wind, lightning, or other covered perils cause the tree to fall. Coverage excludes trees that fell due to rot or neglect, and your policy won't cover tree removal unless the tree damaged a structure. Most policies limit tree removal coverage to $500 to $1,000 per tree.
What's the difference between replacement cost and actual cash value coverage?
Replacement cost coverage pays to rebuild your home or replace belongings at current prices without deducting for depreciation. Actual cash value coverage subtracts depreciation from claim payments. You receive less money based on your property's age and condition. Actual cash value policies cost less up front but leave you covering more expenses out of pocket after a loss.
Do Florida homeowners insurance policies cover flood damage from hurricanes?
No, standard Florida homeowners insurance covers hurricane wind damage but excludes flooding from storm surge or heavy rains. You need separate flood coverage through your insurer or the National Flood Insurance Program.
Our Methodology: Determining the Best Florida Home Insurers
Florida's combination of hurricane exposure, tornado risk and high construction costs makes carrier selection more consequential than in most states. MoneyGeek scored Florida homeowners insurers on three factors:
- Affordability (55%): We compared rates for identical coverage across carriers and evaluated discount availability. Lower costs score higher.
- Customer satisfaction (30%): J.D. Power ratings, Trustpilot reviews and app feedback. Higher scores reflect better claims handling and service responsiveness after storm events.
- Coverage options (15%): We assessed add-on availability, including water backup and inland flood coverage. More options score higher.
Our Sample Profile
Rates reflect a homeowner aged 41-60 with good credit and no prior claims insuring a 2,500-square-foot home built in 2000. Coverage includes $250,000 dwelling coverage, $125,000 personal property coverage, $200,000 personal liability coverage and a $1,000 deductible.
Your rates will vary based on your home's age, location, claims history and credit score.
About Mark Fitzpatrick

Mark Fitzpatrick, a Licensed Property and Casualty (P&C) Insurance Producer in Connecticut, is MoneyGeek's resident insurance expert. He has spent nearly a decade analyzing the market, first at LendingTree and now at MoneyGeek, where he produces original research on hundreds of carriers and millions of rates across auto, home, renters, health and life insurance.
He covers economics and insurance at MoneyGeek, and his work has been featured in The Washington Post, The New York Times and NPR, among other outlets.
Like all MoneyGeek analysts, he draws on independent cost and consumer experience data. No insurance company partnership influences his recommendations.
Fitzpatrick earned his degrees from Johns Hopkins University (M.A. Economics and International Relations) and Boston College (B.A.). His career began in financial risk management at State Street. He's also a five-time “Jeopardy!” champion.
Sources
- NOAA. "National Hurricane Center and Central Pacific Hurricane Center." Accessed June 23, 2026.