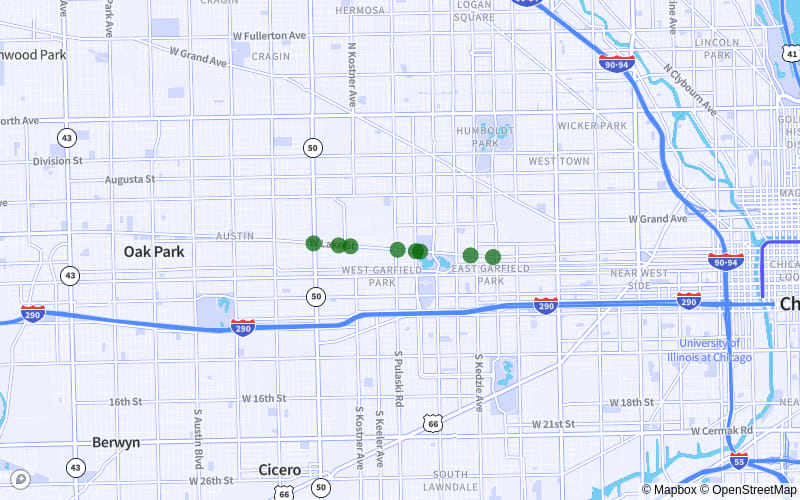
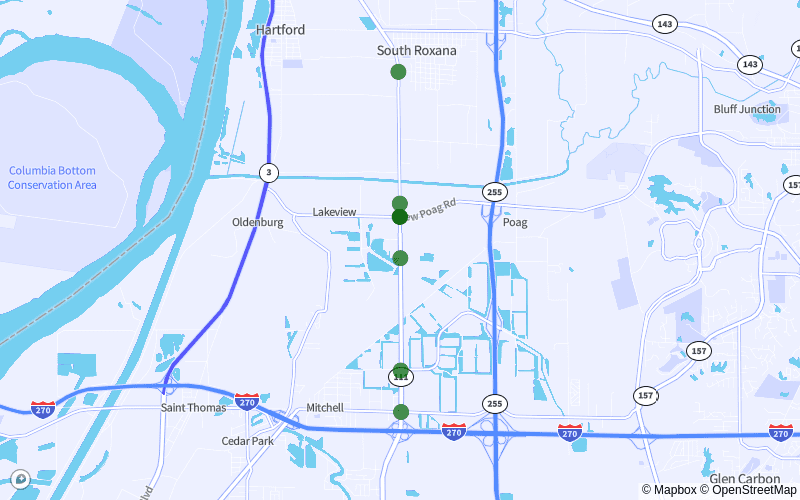
Alt Text

MoneyGeek analyzed the 2,976 motor vehicle accidents that resulted in fatalities in Illinois between 2018 and 2020. Our study covered 1,812 roads out of the state's 306,658 miles of road.

In addition to finding the deadliest stretches of road in the state, our analysis examined the ways driving behaviors — such as speeding, drunk driving and distracted driving — contributed to fatal accidents in Illinois. We also considered environmental factors like time of year and winter weather. Our study presents crash information for all counties in Illinois and highlights the deadliest road in each.

Key Findings

  • Ashland Ave. from W. 74th St. to W. 47th St. in Chicago is Illinois’ deadliest stretch of road. Between 2018 and 2020, nine fatal accidents occurred here.
  • Speeding was involved in 38.9% of accidents, making it the most common contributor to fatal crashes in Illinois. That’s 1,159 fatal accidents from 2018 to 2020. Drunk driving was the second-biggest contributor, involved in 26.5% of deadly accidents.
  • Distracted driving was involved in 12.2% of accidents. While this is significantly lower than the other factors measured, MoneyGeek’s distracted driving study ranked Illinois as the eighth-worst state for distracted driving in the U.S.
  • From 2018 to 2020, July had 312 fatal accidents, the most of any month. August (296) and September (291) have the next two highest counts of deadly crashes. Despite having the 10th-highest number of winter driving fatalities in the U.S., the summer and fall months are Illinois’ deadliest for driving.
  • Cook had the most fatal accidents of any county. The majority of these crashes happened on I-57.

10 Deadliest Road Stretches in Illinois


  • DEADLIEST ROAD IN ILLINOIS
    Ashland Ave. from W. 74th St. to W. 47th St.
    Chicago
    Ashland Ave. from W. 74th St. to W. 47th St.
    • Fatal Accidents:9
    • fatalities:9
    • Crashes Per Mile:2.6
    • distance:3.5 miles
  • I-57 from Exit 353 to Exit 348
    Blue Island | Riverdale | Markham | Posen
    I-57 from Exit 353 to Exit 348
    • Fatal Accidents:8
    • fatalities:9
    • Crashes Per Mile:1.9
    • distance:4.2 miles
  • Lake St. from N. Cicero Ave. to N. Sacramento Blvd.
    Chicago
    Lake St. from N. Cicero Ave. to N. Sacramento Blvd.
    • Fatal Accidents:8
    • fatalities:9
    • Crashes Per Mile:3.5
    • distance:2.3 miles
  • SR-43 Harlem Ave. from W. 34th St. to W. 63rd St.
    Summit | Chicago | Berwyn
    SR-43 Harlem Ave. from W. 34th St. to W. 63rd St.
    • Fatal Accidents:8
    • fatalities:8
    • Crashes Per Mile:2.2
    • distance:3.7 miles
  • I-55 from Exit 287 to 292B
    Chicago
    I-55 from Exit 287 to 292B
    • Fatal Accidents:7
    • fatalities:8
    • Crashes Per Mile:1.6
    • distance:4.3 miles
  • I-290 from Exit 15A to Exit 21B
    Forest Park | Maywood | Chicago
    I-290 from Exit 15A to Exit 21B
    • Fatal Accidents:7
    • fatalities:8
    • Crashes Per Mile:1.4
    • distance:4.9 miles
  • SR-111 from Chain of Rocks Rd. to Broadway Ave.
    South Roxana | Pontoon Beach
    SR-111 from Chain of Rocks Rd. to Broadway Ave.
    • Fatal Accidents:7
    • fatalities:8
    • Crashes Per Mile:1.6
    • distance:4.4 miles
  • I-80 from Exit 134 to Exit 127
    Joliet
    I-80 from Exit 134 to Exit 127
    • Fatal Accidents:7
    • fatalities:7
    • Crashes Per Mile:1.4
    • distance:4.9 miles
  • I-94 from Exit 56B to Exit 62
    Chicago
    I-94 from Exit 56B to Exit 62
    • Fatal Accidents:7
    • fatalities:7
    • Crashes Per Mile:1.5
    • distance:4.7 miles
  • 87th St. from S. Lafayette Ave. to S. Pulaski Rd.
    Chicago | Evergreen Park
    87th St. from S. Lafayette Ave. to S. Pulaski Rd.
    • Fatal Accidents:7
    • fatalities:7
    • Crashes Per Mile:1.4
    • distance:5.0 miles

Drunk Driving Involved in 26.5% of Fatal Accidents

MoneyGeek looked at the 2,976 fatal crashes in Illinois from 2018 to 2020 and found that 26.5% involved drunk driving. Drunk driving was the second-most common factor present in these accidents.

A blood alcohol concentration of 0.08% makes you legally intoxicated in Illinois. However, a BAC of 0.02% already diminishes your driving ability. Having about two alcoholic drinks alters your mood and makes you more relaxed. Unfortunately, it also makes tracking a visual target and multitasking a challenge, which can be incredibly dangerous behind the wheel.

The cost of drunk driving may not always be a fatal accident, but you’ll still have to deal with extensive and long-lasting consequences. Cheap car insurance in Illinois is considerably harder to find after a DUI charge. You’ll need to carry SR-22 car insurance in Illinois, which is more expensive than any other type of policy available. Graver repercussions may involve restricted driving privileges, fines and even jail time.

Speeding Is a Factor in 38.9% of Fatal Crashes

The leading factor contributing to fatal accidents in Illinois from 2018 to 2020 was speeding. It was involved in 38.9% of crashes — that’s 1,159 of 2,976.

The dangers of speeding reach beyond breaking the law. You’ll have difficulty controlling your car, leading to more crashes. It also increases the force of any potential impact, making safety equipment like airbags and seatbelts less effective.

Distracted Driving Contributed to 12.2% of Fatal Accidents

Distracted driving contributed to 12.2% of all fatal crashes in Illinois; that translates to 362 accidents resulting in death between 2018 and 2020. Although the state doesn’t allow drivers to use mobile phones or other electronic devices while driving, it remains the eighth-worst state for distracted driving in the U.S., according to MoneyGeek’s distracted driving study.

July Had More Fatal Accidents Than Any Other Month

MoneyGeek analyzed which time of the year most fatal accidents in Illinois occur. Between 2018 and 2020, 312 happened in July, the most of any month. That's 10.5% of all deadly crashes recorded.

July falls within the 100 Deadliest Days of Summer, or the months between Memorial Day and Labor Day when motor crashes increase considerably — especially for teen drivers. August and September have the next-highest numbers of fatal crashes.

While most crashes in Illinois occur during the summer and early fall months, MoneyGeek’s winter driving study ranked the state as the 10th most dangerous in the country for winter driving.

Driving Safely Protects You, Others and Your Wallet

Several advantages come with being a safe driver in Illinois. More than helping keep the roads free of danger, it also allows you to save money. However, accidents can happen, even when you take extensive precautions. At times like these, it’s crucial to be insured. An affordable full coverage car insurance policy can protect you and your loved ones against financial stress after a collision without expensive premiums.

The average cost of car insurance in Illinois is $1,134 for a full coverage policy. That’s also how much you’ll pay if you buy full coverage auto insurance in Chicago. However, your annual premium may vary if you live in a different city. For example, you’ll only spend $837 annually for car insurance in Aurora. That’s a difference of $297.

Remember that these figures are only averages. Insurers consider other factors, such as your age, driving history and car make and model. It may lead them to charge you a different rate. It’s best to compare quotes from multiple providers to find which one offers the cheapest car insurance.

Fatal Accidents and Most Dangerous Roads: County Breakdown

MoneyGeek’s analysis shows that the five counties in Illinois with the highest number of fatal accidents make up 46% of all recorded incidents between 2018 and 2020. That translates to 1,362 deadly crashes. Cook County had 869 accidents, the most of any county. Most of these happened along I-57 and involved speeding and distracted driving.

Methodology

MoneyGeek analyzed data from the National Highway Traffic Safety Administration Fatal Accident Reporting System database using fatality data from 2018, 2019 and 2020. Currently, 2020 is the latest data available in the system.

About Doug Milnes, CFA


Doug Milnes, CFA headshot

Doug Milnes is a CFA charter holder with over 10 years of experience in corporate finance and the Head of Credit Cards at MoneyGeek. Formerly, he performed valuations for Duff and Phelps and financial planning and analysis for various companies. His analysis has been cited by U.S. News and World Report, The Hill, the Los Angeles Times, The New York Times and many other outlets.

Milnes holds a master’s degree in data science from Northwestern University. He geeks out on helping people feel on top of their credit card use, from managing debt to optimizing rewards.


sources