
To find the deadliest roads in Arizona, MoneyGeek analyzed the 2,795 fatal crashes that occurred in the state from 2018–2020, the most recent years of currently available data. The analysis looked at 961 roads within Arizona's 146,465 miles of road and examined how factors like drunk driving, speeding, distracted driving and time of year contributed to the number of deadly accidents. The study also outlines summarized data for every county in the state and identifies the deadliest road in each. We found that, overall, fatal accidents in Arizona are on the rise: from 2019 to 2020, the number of fatal crashes increased by 6.3%.
Arizona Fatal Accident Study:
Arizona’s Deadliest Roads and Fatal Accident Statistics
Updated: May 8, 2026
Advertising & Editorial Disclosure

Key Findings
- Indian School Road from N 3rd Street to N 43rd Avenue is Arizona’s deadliest stretch of road. This road is located in Phoenix.
- From 2019 to 2020, Arizona saw a 9.4% increase in deadly speeding accidents. Speeding also contributed the most to fatal accidents in the three years analyzed (31.3%).
- Arizona saw improvements in the number of accidents involving distracted and drunk driving, with a 51% decrease in fatal crashes related to distracted driving and a 12.8% decrease in those related to drunk driving from 2019 to 2020. Each of these factors was involved in 7.3% and 20.0% of crashes from 2018 to 2020, respectively.
- Most crashes occurred in October, followed by September and May. April was the most deadly month for speeding-related crashes, with 85 fatal accidents.
- Maricopa had the most fatal accidents of any county. Most of these happened on I-10 and involved speeding (30.0%) or drunk driving (20.8%).
10 Deadliest Road Stretches in Arizona
- 1. Indian School Road from N 3rd Street to N 43rd AvenueRoute Notes:
 Phoenix
- 22Fatal Accidents
- 24fatalities
- 5Crashes Per Mile
- 4.5 milesdistance
- (33.49463056, -112.0692361)start
- (33.49496944, -112.1468944)end
- [ 1 3 7 9 12 13 19 20 21 22 24 25 29 32 35 46 48 49 50 51 52 53]points
- 108ordering
- {'Phoenix'}localities
- {'Maricopa'}counties
- TRUEintersect
- Indian School RdTWAY_ID
- 2. Indian School Road from N 89th Avenue to N 51st AvenueRoute Notes:
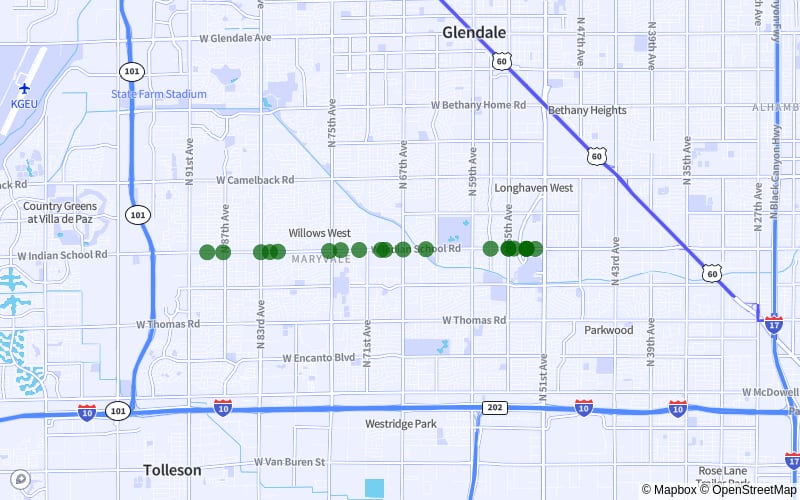 Phoenix
- 20Fatal Accidents
- 20fatalities
- 4Crashes Per Mile
- 4.6 milesdistance
- (33.49425, -112.2507861)start
- (33.49495278, -112.1711639)end
- [ 0 2 4 5 8 14 16 17 18 23 27 30 31 33 38 39 40 42 47 54]points
- 87ordering
- {'Phoenix'}localities
- {'Maricopa'}counties
- TRUEintersect
- Indian School RdTWAY_ID
- 3. 43rd Avenue from W Lamar Road to McDowell RoadRoute Notes:
 Phoenix
- 16Fatal Accidents
- 17fatalities
- 3Crashes Per Mile
- 4.9 milesdistance
- (33.53685278, -112.1514611)start
- (33.465975, -112.1518167)end
- [ 0 1 2 3 4 5 6 7 10 12 14 15 16 19 23 24]points
- 52ordering
- {'Phoenix'}localities
- {'Maricopa'}counties
- TRUEintersect
- 43Rd AveTWAY_ID
- 4. Bethany Home Road from N 17th Avenue to N 56th AvenueRoute Notes:
 Phoenix | Glendale
- 15Fatal Accidents
- 18fatalities
- 3Crashes Per Mile
- 4.9 milesdistance
- (33.524075, -112.0960389)start
- (33.52404444, -112.1802306)end
- [ 1 4 5 6 8 9 11 12 13 14 15 16 17 18 19]points
- 46ordering
- {'Phoenix', 'Glendale'}localities
- {'Maricopa'}counties
- TRUEintersect
- Bethany Home RdTWAY_ID
- 5. Mcdowell Road from N Bushmaster Boulevard to N 24th StreetRoute Notes:
 Phoenix
- 13Fatal Accidents
- 14fatalities
- 3Crashes Per Mile
- 3.9 milesdistance
- (33.46558611, -111.9630056)start
- (33.46579722, -112.0306694)end
- [ 3 9 11 14 17 18 20 22 25 26 27 28 29]points
- 43ordering
- {'Phoenix'}localities
- {'Maricopa'}counties
- TRUEintersect
- Mcdowell RdTWAY_ID
- 6. Cave Creek Road from E Union Hills Drive to E Desert Cove AvenueRoute Notes:
 Phoenix
- 11Fatal Accidents
- 11fatalities
- 2Crashes Per Mile
- 4.8 milesdistance
- (33.65357778, -112.0308333)start
- (33.5858, -112.0494278)end
- [ 1 2 3 4 5 6 7 8 10 13 14]points
- 25ordering
- {'Phoenix'}localities
- {'Maricopa'}counties
- TRUEintersect
- Cave Creek RdTWAY_ID
- 7. Bell Road from N 3rd Street to N 43rd AvenueRoute Notes:
 Phoenix | Glendale
- 10Fatal Accidents
- 13fatalities
- 2Crashes Per Mile
- 4.9 milesdistance
- (33.64036389, -112.0698333)start
- (33.63932778, -112.1548)end
- [ 2 3 6 7 8 10 11 12 14 16]points
- 20ordering
- {'Phoenix', 'Glendale'}localities
- {'Maricopa'}counties
- TRUEintersect
- Bell RdTWAY_ID
- 8. Thunderbird Road from N 59th Avenue to N 21st AvenueRoute Notes:
 Phoenix | Glendale
- 10Fatal Accidents
- 11fatalities
- 2Crashes Per Mile
- 4.7 milesdistance
- (33.61073889, -112.1858556)start
- (33.61105556, -112.1038778)end
- [ 0 1 2 3 4 5 6 8 9 10]points
- 21ordering
- {'Phoenix', 'Glendale'}localities
- {'Maricopa'}counties
- TRUEintersect
- Thunderbird RdTWAY_ID
- 9. 35th Avenue from W Van Buren Street to W Bethany Home RoadRoute Notes:
 Phoenix
- 10Fatal Accidents
- 10fatalities
- 2Crashes Per Mile
- 5.0 milesdistance
- (33.45139444, -112.1345389)start
- (33.52330278, -112.1342778)end
- [ 1 3 4 5 6 8 9 10 12 19]points
- 20ordering
- {'Phoenix'}localities
- {'Maricopa'}counties
- TRUEintersect
- 35Th AveTWAY_ID
- 10. 51st Avenue from W Roosevelt Street to West Vermont AvenueRoute Notes:
 Phoenix | Glendale
- 10Fatal Accidents
- 10fatalities
- 3Crashes Per Mile
- 3.9 milesdistance
- (33.45859722, -112.1692083)start
- (33.5158, -112.1687639)end
- [ 0 1 3 5 6 10 15 16 17 18]points
- 25ordering
- {'Phoenix', 'Glendale'}localities
- {'Maricopa'}counties
- TRUEintersect
- 51St AveTWAY_ID
Drunk Driving Involved in 20.0% of Fatal Accidents
Between 2018 and 2020, 558 out of 2,795 fatal accidents in Arizona involved drunk driving. Most (20.0%) of deadly crashes in Arizona involved drunk driving. The state saw a 12.8% decrease in car accidents related to drunk driving from 2019 to 2020.
Driving under the influence of even the smallest amount of alcohol can impair the decision-making skills and coordination necessary to navigate the roads safely. A blood alcohol concentration (BAC) of 0.02% is enough to visibly impair your driving, while a BAC of 0.08% means you are considered legally intoxicated.
If you get caught driving drunk, you face penalties and long-lasting consequences. The costs of drunk driving are a suspended driver’s license, fines and possible jail time. It can also make finding affordable car insurance after a DUI difficult, as drivers are required to file for Arizona SR-22 insurance after a DUI.
Speeding Is a Factor in 31.3% of Fatal Crashes
Within a three-year period, 875 of Arizona’s deadly accidents involved speeding. Speeding was involved in the highest number of fatal crashes from 2018 to 2020. From 2019 to 2020, the state saw a 9.4% increase in crashes involving speeding.
If you drive over the speed limit, you are more likely to lose control of your car, increasing the risk of crashing and causing severe injuries. In Arizona, speeding is considered a violation that can incur three points. Accumulating eight or more points in 12 months results in driving privilege suspension.
Distracted Driving Contributed to 7.3% of Fatal Accidents
Out of 2,795 fatal accidents that occurred in Arizona between 2018 and 2020, 205 involved distracted driving. To curb distracted driving, the state government enacted a Hands-Off law in April 2020, legally prohibiting drivers from using their phones while driving, with a few exceptions, such as using phones for navigation or reporting a crime. It seems to be working: from 2019 to 2020, Arizona saw a 51% decrease in deadly crashes involving distracted driving. Of the three factors we measured, distracted driving contributed to the smallest number of fatal accidents in the state.
October Had More Fatal Accidents Than Any Other Month
In Arizona, October had the most fatal accidents compared to any other month in the three years analyzed, with 257 crashes. September and May had the next two highest numbers of deadly crashes, with 248 and 243 accidents, respectively.
MoneyGeek found that speeding was the factor most commonly involved in deadly crashes in Arizona; from 2018 to 2020, most fatal accidents involving speeding occurred in April.
Driving Safely Protects You, Others and Your Wallet
From keeping Arizona roadways safe to saving on insurance premiums, practicing safe driving habits has many benefits. Drivers can start driving safely by taking safety courses, practicing defensive driving and ensuring they have auto insurance. After all, even the most cautious drivers can still get into accidents — and a full coverage auto insurance policy is essential to financially protect yourself and your loved ones after a crash. Fortunately, it’s possible to find cheap full coverage auto insurance.
On average, full coverage insurance in Arizona costs $1,284 per year, but rates can change depending on where you live in the state. For instance, drivers pay an average of $1,430 annually for auto insurance in Phoenix; meanwhile, car insurance coverage in Tucson costs $1,167 per year, on average. Between the two cities, the average difference in auto insurance costs per year is $263.
Keep in mind that your rates may be different than these averages. Aside from your specific location within the state, your age, driving record and even your credit score can affect your auto insurance premiums. Make sure to compare quotes to find the cheapest auto insurance companies in your area.
Fatal Accidents and Most Dangerous Roads: County Breakdown
Maricopa, Pima, Pinal, Yavapai and Mohave counties had the highest number of fatal accidents in Arizona, with 2,204 crashes combined. Seventy-nine percent of the state’s total number of fatal accidents between 2018 and 2020 occurred in these five counties.
Maricopa County had the most deadly crashes in the three-year period, with a staggering 1,353 accidents — the majority of which occurred on the I-10. Speeding (30.0%) and drunk driving (20.8%) were the two most common factors involved in these accidents.
Methodology
MoneyGeek analyzed 2018, 2019 and 2020 data from the National Highway Traffic Safety Administration’s Fatal Accident Reporting System (FARS) database. Currently, 2020 is the latest data available in the system.
About Doug Milnes, CFA

Doug Milnes is a CFA charter holder with over 10 years of experience in corporate finance. He led the Credit Cards vertical at MoneyGeek. At Duff and Phelps, he performed valuations. He later conducted financial planning and analysis at several other companies. His analysis has been cited by U.S. News & World Report, The Hill, the Los Angeles Times, the New York Times and many other outlets.
Doug holds a master's degree in data science from Northwestern University. He writes about credit card strategy, including debt management and rewards.