Compound Interest Calculator

Estimate your savings or spending through our compound interest calculator. Enter your initial amount, contributions, rate of return and years of growth to see how your balance increases over time.

After 10 years, your total balance is $29,542
After 10 years, 
your total balance is 
$29,542
Growth Over Time
Initial Amount
Total Contributions
Total Interest Earned

Compound Interest Calculator

Updated: September 29, 2026

Advertising & Editorial Disclosure

Compound interest means your money earns interest on your original investment and accumulated interest. Over time, even small amounts can grow into real wealth.

Our compound interest calculator shows how your savings or debt will grow. Enter your starting amount, contributions, rate of return and years of growth to see how compounding frequency affects your balance.
What Is Compound Interest?

Compound interest is interest earned on your original principal and accumulated interest. You earn what's called "interest on interest." Over time, this speeds up your savings growth and the cost of any debt you carry.

Unlike simple interest, which calculates interest only on the original principal, compound interest adds earned interest back to your balance. Each calculation uses a slightly larger base. Because of this, each interest payment is larger than the one before, and growth compounds over time.

The MoneyGeek Compound Interest Calculator is a free online tool. Enter a few details to see how your savings or debt will grow.

Compound Interest Formula

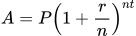
Compound interest calculates the total future value of an investment or loan.

A = P (1 + r/n)^(nt)

What Each Variable Means

  • A = future value: what your investment or loan is worth after interest accumulates
  • P = principal: the amount you put in or borrowed to start
  • r = annual interest rate as a decimal (5% becomes 0.05)
  • n = number of times interest compounds per year (12 for monthly, 1 for annual)
  • t = number of years your money is invested or the loan runs

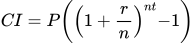
How to Find Interest Earned Only

Subtract the principal from the future value to find your interest earned:

CI = P((1+r/n)^(nt)-1)

Formula for Accounts With Regular Contributions

Use this formula if your account includes regular contributions:

A = P(1+r/n)^(nt)+c[((1+r/n)^(nt)-1)/(r/n)]
Where:

  • c = your regular contribution amount

The calculator runs these formulas on its own. Choose monthly contributions and it applies monthly compounding, even when your contribution is $0. Choose annual contributions and it switches to annual compounding.

How to Calculate Compound Interest

You can run these calculations by hand, but they get complicated fast. Add regular contributions or change how often interest compounds, and you're looking at dozens of calculations for a single 10-year period.

Manual Calculation Example

Say you invest $1,000 at 5% annual interest, compounded annually for three years:

Year 1: $1,000 × 1.05 = $1,050
Year 2: $1,050 × 1.05 = $1,103
Year 3: $1,103 × 1.05 = $1,158

Your investment grows to $1,158, earning $158 in compound interest.

The formula confirms it: A = 1,000(1 + 0.05/1)^(1×3) = $1,158

Why Our Calculator Saves Time

That manual calculation took three steps for just three years with no added contributions. Scale that to regular deposits or monthly compounding over 10 or 20 years, and you're looking at dozens of steps. The compound interest calculator handles all of it.

Enter your starting amount, contributions, rate of return and timeframe to run any scenario. The calculator shows year-by-year growth through bar charts and breaks your balance into a pie chart by source: principal, contributions and interest earned. A table shows the annual totals. Adjust any input to see results instantly.

How to Use MoneyGeek’s Compound Interest Calculator

Use our calculator to estimate future interest on savings, investments or debt.

  1. 1
    Enter Your Initial Amount

    Enter your principal, the amount you're starting with. Try $500 to see how the balance builds over time. A higher starting amount earns more interest from day one.

  2. 2
    Set Monthly or Annual Contributions

    Set your contribution amount and choose monthly or annual. Monthly contributions compound more often and build faster than annual ones. Try different amounts to see how they shift your final balance.

  3. 3
    Estimate Your Rate of Return

    Pick the annual interest rate you expect to earn or pay. Even a 1% to 2% difference can shift your final balance by thousands. Try a few rates to see how much it matters.

  4. 4
    Set the Number of Years of Growth

    Choose how many years your money will stay invested or how long you have to pay off your debt. Start with five, then push it to 10 or 20 to see how much time changes the total.

  5. 5
    Use the Bar Chart to Explore Growth Over Time

    The bar chart tracks your balance year by year. Growth is slow at first, then picks up as your accumulated interest starts compounding.

  6. 6
    Examine the Totals by Source Pie Chart

    The pie chart breaks your balance into three slices: initial principal (purple), contributions (blue) and interest earned (green). Use it to see how much your money made versus how much you put in.

  7. 7
    Review the Table View

    The table gives you a year-by-year breakdown: starting balance, contributions, cumulative contributions, interest earned, cumulative interest and total balance. Scan the rows to track how your balance grows.

  8. 8
    Test Different Scenarios

    Adjust contributions, rates or timeframes to see what moves your balance the most. Try front-loading your contributions rather than spreading them out. Small changes can shift your final balance by thousands.

Key Calculator Features

Results update in real time as you make changes. Set contributions to monthly or annual and choose your compounding frequency. The charts and table give you a year-by-year breakdown of how each input affects your balance.

How the Calculator Works

The calculator applies the compound interest formula to your inputs period by period. It calculates interest for each interval, adds it to your balance and uses that new total as the base for the next cycle. The process repeats for every period in your timeframe.

With monthly compounding, it divides your annual rate by 12 and runs 12 cycles per year. Annual compounding applies the full rate once.

How Compound Interest Works

Compound interest works differently for savers and borrowers.

For Savings and Investments

For retirement and education savings, compound interest is your biggest growth driver. The interest you earn in early years starts compounding on itself, so even small, regular contributions add up fast. Returns build slowly at first, then pick up speed as your balance grows.

For Debt

If you're paying off debt, compound interest works against you. When you carry a balance, unpaid interest gets added to what you owe, and the next billing cycle charges interest on that higher amount. Pay it down faster to cut how much interest builds up.

Simple Interest vs. Compound Interest

With simple interest, you earn interest only on your original principal. At 10% annually on $100, you earn $10 a year. After 20 years, you'd have $300: your $100 principal plus $200 in interest.

Compound interest adds your earnings back to the balance, so future interest is calculated on a higher amount. In the second year, you'd earn interest on $110 instead of $100. Over 20 years, that same $100 grows to $673.

The gap between the two methods widens over time. In the short term, it's small. Give it decades, and compound interest pulls far ahead.

Real-World Growth Example

Here's how $500 grows at an 8% annual return with monthly compounding. Interest earned by year:

  • Year 1: $42
  • Year 2: $86
  • Year 3: $135
  • Year 4: $188
  • Year 5: $245

Each year's interest is larger than the last. Growth picks up as your balance climbs.

Compound Interest in Cash Value Life Insurance

With whole life insurance, cash value grows at a guaranteed 2% to 5% annually.

If you pay $3,000 in annual premiums with $2,000 going toward cash value:

  • Year 1: $2,060 cash value (3% growth)
  • Year 5: $10,627 cash value
  • Year 10: $23,160 cash value
  • Year 20: $54,919 cash value

Returns are lower than market-based investments, but they're guaranteed and tax-advantaged. Cash value grows without market volatility, and you can access it through loans or withdrawals.

Starting earlier gives the cash value more time to grow. With $2,000 a year directed toward cash value, you reach nearly $55,000 over 20 years. Use that figure to decide whether a permanent life policy is worth the higher premium.

Compound Interest in Insurance Products

All permanent life insurance policies build cash value through compound interest.

Cash Value Growth in Permanent Life Insurance

Whole life and universal life policies include a cash value component alongside your death benefit. Your premiums cover your death benefit and cash accumulation. Cash value grows at rates set in your policy: 2% to 5% for whole life.

Universal life policies tie returns to market indexes, so you could earn more, but there's no guaranteed rate. Cash value grows tax-deferred, and you can tap it through loans or withdrawals while you're alive.

How Life Insurance Cash Value Differs From Investments

Unlike traditional investments, life insurance cash value comes with built-in guarantees. Your principal is protected, and policies spell out minimum growth rates in the contract. It won't match long-term stock returns, but it won't lose value either.

These policies combine coverage with a savings component, which affects the overall cost and your net return. When comparing permanent life insurance to stocks and bonds, weigh whether you need financial protection, growth or both.

Loading...

About Nathan Paulus


Nathan Paulus, Head of Content and SEO, MoneyGeek

Nathan Paulus is the Senior Director of Content and SEO at MoneyGeek, where he leads content strategy and conducts original data research across insurance, consumer costs, transportation safety, housing, public policy and personal finance. He reviews studies for methodology, source quality and factual accuracy.

Research and Analysis

In more than six years at MoneyGeek, Nathan has published more than 100 original studies and explanatory guides. His insurance research includes 50-state comparisons of health care outcomes, costs and access, and an analysis of how uninsured rates track with state Medicaid expansion decisions and electoral patterns. 

He has analyzed full-coverage auto rates across major insurers in all 50 states and tracked how premium trends relate to industry underwriting losses. That research draws on combined ratio data from Fitch Ratings and AM Best, plus the Bureau of Labor Statistics CPI figures. Beyond insurance, his work spans vehicle pricing trends across the U.S. new car market, summer traffic fatality rates by state, homeowner underinsurance ratios using mortgage and policy data, and housing affordability across all 50 states.

His research has been cited by Bloomberg, the Los Angeles Times, Forbes, Fast Company, the San Francisco Chronicle, USA Today and NBC Los Angeles. Harvard, MIT, Stanford and Yale have referenced his work.

Career

Nathan traces his interest in personal finance back to his grandmother, who ran her household on a simple rule: spend less than you make and save the difference before anything else. That rule shows up in his work today. His writing skips jargon and complex strategy in favor of the basics that help someone living paycheck to paycheck.

He joined MoneyGeek in July 2020 as Director of Content Marketing, where he led the content team and oversaw data journalism production across insurance and personal finance verticals. A promotion to Head of Marketing and Communications followed in December 2023. The new role added digital PR and communications strategy to his responsibilities. He was appointed Head of Content and SEO in January 2025.

Before MoneyGeek, Nathan served as Director of Content Marketing and SEO at Ventrix Advertising, where he helped build two content sites from scratch, contributed to link-building programs that generated more than 1,500 unique referring domains within a year and co-managed a marketing team of more than 20 people. Two and a half years at ABUV Media preceded that role. He advanced from Marketing Research Analyst to Senior Marketing Tactics Analyst, where he built expertise in audience research, content strategy and SEO.