Making informed financial decisions doesn't require hiring an expensive advisor or spending hours researching conflicting information. MoneyGeek's collection of calculators, guides, and data-driven analyses puts proven tools directly in your hands.
Whether you're planning for retirement, comparing insurance coverage, evaluating loan options, or understanding how your money works in different cities across America, you'll find resources built to answer your specific questions with personalized estimates.
Each calculator and analysis reflects MoneyGeek's commitment to financial transparency. Our calculators draw from current market data and real pricing information. Our analyses are conducted independently, covering everything from insurance costs by state to end-of-life expenses nationwide. We publish the methodology behind our findings so you can trust the numbers you're seeing.
Start with a calculator to get personalized estimates for your situation. Dive into an analysis to understand broader trends affecting your finances. Use guides to deepen your understanding. We've organized these resources to be easy to navigate and immediately useful.
Calculators
Our calculators deliver personalized estimates in minutes. Input your specific situation, whether that's your age, location, income, coverage needs, or financial goals and receive accurate projections to guide your decisions. Each calculator incorporates current market data and MoneyGeek's research to reflect today's rates and real-world pricing. Use these calculators as your starting point for understanding costs, savings potential, and coverage needs.
Research and Analysis
Our independent analyses reveal trends shaping your financial decisions. We investigate real data on insurance costs, health coverage, housing expenses, and regional economics to answer the questions affecting millions of Americans. Each analysis includes detailed methodology so you understand how we reached our conclusions. Our findings often challenge industry assumptions and reveal surprising regional patterns that matter to your bottom line
Latest in Analysis
Average Handyman Insurance Cost (2026 Report)
Jun 30, 2026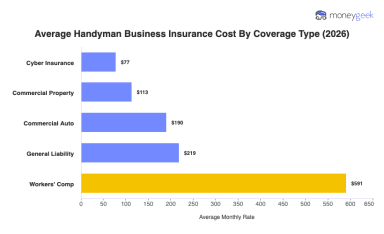
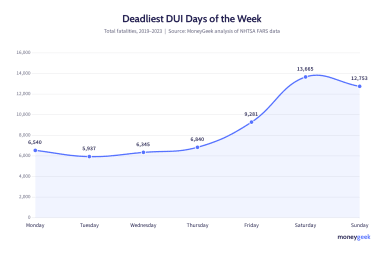
Deadliest States to Drive on July 4th
Jun 29, 2026
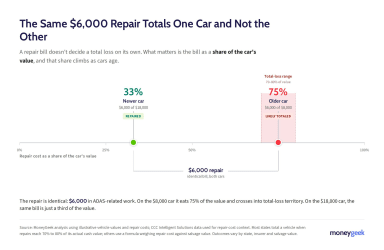
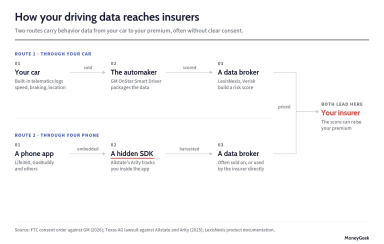
Why Auto Insurance Rates Rise as Claims Fall
Jun 29, 2026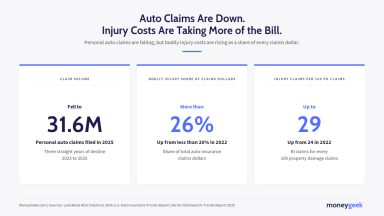
Why Young Adults Skip Life Insurance
Jun 29, 2026
Best Ohio General Liability Insurance (2026)
Jun 28, 2026
Best General Liability Insurance in Indiana (2026)
Jun 28, 2026
Best General Liability Insurance Companies in Colorado (2026)
Jun 28, 2026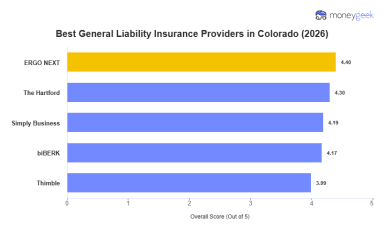
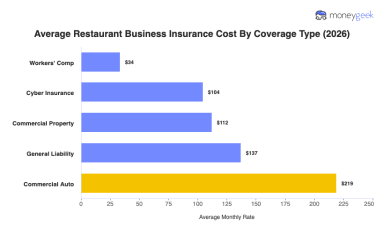
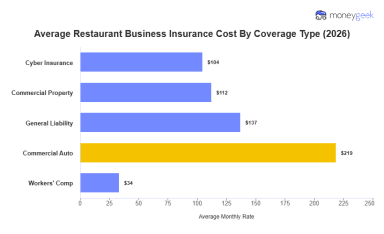
Average Restaurant Insurance Cost (2026 Report)
Jun 28, 2026