
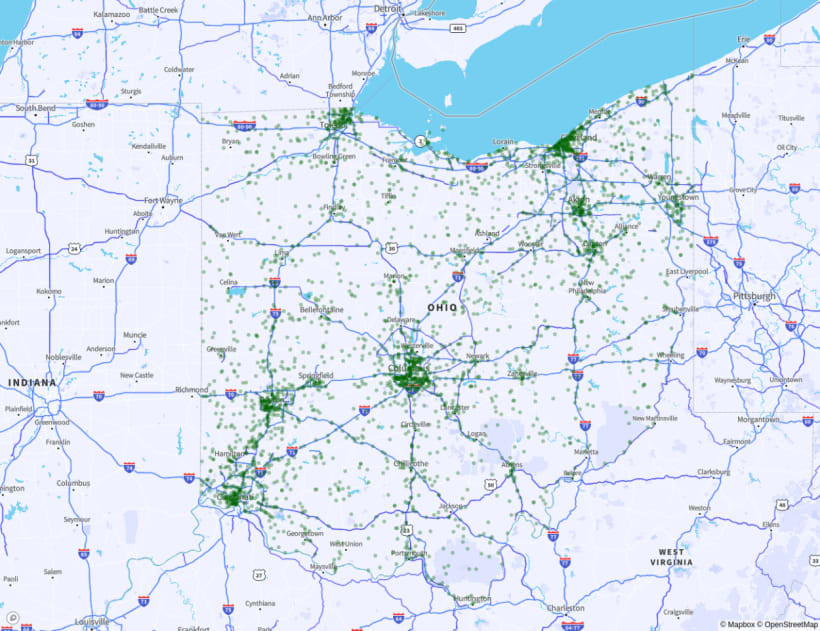
Over three years, 3,189 car crashes in Ohio resulted in fatalities. From 2018 to 2020, MoneyGeek found several factors involved in these accidents, including drunk driving, speeding and distracted driving. The study examined accidents on 1,940 roads out of the state's 262,492 miles of road and broke down crash statistics by county.
Ohio Fatal Accident Study:
Ohio’s Deadliest Roads and Fatal Accident Statistics
Updated: May 8, 2026
Advertising & Editorial Disclosure
Key Findings
I-71 between Exits 110B and 116 is the deadliest stretch of road in Ohio. Columbus, where this road is located, is home to five of the state's 10 deadliest roads.
32.3% of fatal accidents in Ohio involved drunk driving while speeding contributed to 27.4% of accidents.
Distracted driving was involved in 5.1% of accidents. Compared to other states, Ohio’s numbers in this category are fairly low. MoneyGeek's worst states for distracted driving study ranked Ohio better than 69% of states.
August had the most fatal accidents (10.8%), followed by July (10.6%) and September (10.2%).
Franklin had more deadly accidents than any other county. Cuyahoga and Hamilton County had the next two highest numbers of fatal crashes.
10 Deadliest Road Stretches in Ohio
- 1. I-71 from Exit 110B to Exit 116Cities:Columbus
 Columbus
- 11Fatal Accidents
- 15fatalities
- 2Crashes Per Mile
- 5.0 milesdistance
- (39.99223333, -82.98514444)start
- (40.06385, -82.99778889)end
- [ 3 9 10 13 15 16 25 30 32 44 50]points
- 24ordering
- {'Columbus'}localities
- {'Franklin'}counties
- TRUEintersect
- I-71TWAY_ID
- 2. US-40 Broad Street from Dana Avenue to Nationwide BoulevardCities:Columbus
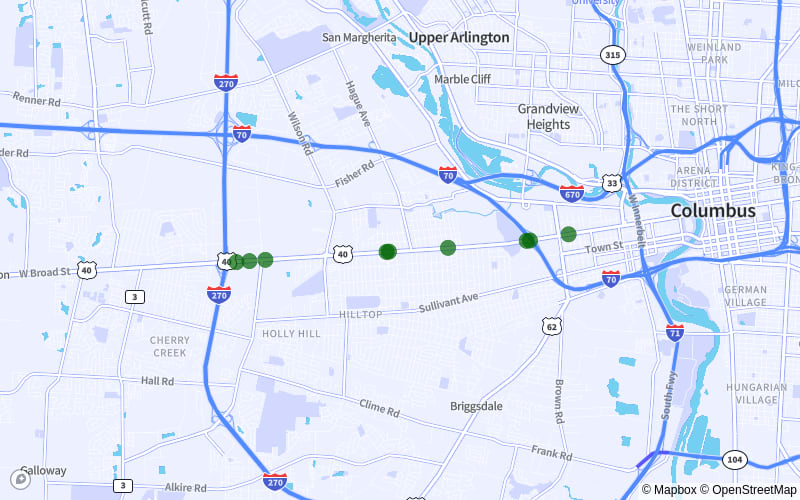 Columbus
- 9Fatal Accidents
- 10fatalities
- 2Crashes Per Mile
- 4.3 milesdistance
- (39.95794722, -83.03579167)start
- (39.95276389, -83.11641667)end
- [0 1 2 3 4 5 6 7 8]points
- 19ordering
- {'Columbus', 'Not Applicable'}localities
- {'Franklin'}counties
- TRUEintersect
- US-40 Broad StTWAY_ID
- 3. I-75 from Exit 21 to Exit 14Cities:Sharonville | West Chester
 Sharonville | West Chester
- 7Fatal Accidents
- 8fatalities
- 2Crashes Per Mile
- 4.4 milesdistance
- (39.33293889, -84.41221111)start
- (39.272575, -84.44028056)end
- [ 3 10 17 18 26 48 49]points
- 11ordering
- {'Sharonville', 'West Chester', 'Not Applicable'}localities
- {'Hamilton', 'Butler'}counties
- TRUEintersect
- I-75TWAY_ID
- 4. Outerbelt S Freeway from Exit 21 to Exit 16Cities:Cleveland | Valley View | Independence
 Cleveland | Valley View | Independence
- 7Fatal Accidents
- 8fatalities
- 2Crashes Per Mile
- 4.7 milesdistance
- (41.40830833, -81.63389444)start
- (41.42179444, -81.72225278)end
- [1 2 3 5 7 8 9]points
- 10ordering
- {'Cleveland', 'Valley View', 'Independence'}localities
- {'Cuyahoga'}counties
- TRUEintersect
- I-480TWAY_ID
- 5. I-75 from Exit 4 to Exit 10ACities:Cincinnati | Saint Bernard
 Cincinnati | Saint Bernard
- 7Fatal Accidents
- 7fatalities
- 2Crashes Per Mile
- 3.8 milesdistance
- (39.16181111, -84.52118333)start
- (39.2, -84.46923889)end
- [ 9 27 44 45 50 52 55]points
- 13ordering
- {'Cincinnati', 'Saint Bernard', 'Not Applicable'}localities
- {'Hamilton'}counties
- TRUEintersect
- I-75TWAY_ID
- 6. Jack Nicklaus Freeway from Exit 43A to Exit 35Cities:Columbus | Gahanna
 Columbus | Gahanna
- 7Fatal Accidents
- 7fatalities
- 1Crashes Per Mile
- 5.0 milesdistance
- (39.94374167, -82.84680833)start
- (40.00817778, -82.88910278)end
- [ 5 11 16 22 23 25 26]points
- 10ordering
- {'Columbus', 'Gahanna'}localities
- {'Franklin'}counties
- TRUEintersect
- I-270TWAY_ID
- 7. I-75 from Exit 50B to Exit 47Cities:West Carrollton | Moraine
 West Carrollton | Moraine
- 6Fatal Accidents
- 10fatalities
- 2Crashes Per Mile
- 3.0 milesdistance
- (39.72558611, -84.209675)start
- (39.68510833, -84.22941111)end
- [ 2 20 38 39 40 42]points
- 12ordering
- {'West Carrollton', 'Moraine'}localities
- {'Montgomery'}counties
- TRUEintersect
- I-75TWAY_ID
- 8. Jack Nicklaus Freeway from Exit 52 to Exit 2Cities:Columbus
 Columbus
- 6Fatal Accidents
- 7fatalities
- 1Crashes Per Mile
- 4.3 milesdistance
- (39.87621667, -83.0092)start
- (39.90468889, -83.08073056)end
- [ 0 1 6 7 14 18]points
- 8ordering
- {'Columbus', 'Not Applicable'}localities
- {'Franklin'}counties
- TRUEintersect
- I-270TWAY_ID
- 9. Lakeland Freeway from Exit 179 to Exit 183Cities:Cleveland | Euclid | Bratenahl
 Cleveland | Euclid | Bratenahl
- 6Fatal Accidents
- 7fatalities
- 1Crashes Per Mile
- 4.6 milesdistance
- (41.55935833, -81.593475)start
- (41.59314444, -81.51638056)end
- [ 2 8 9 12 15 19]points
- 8ordering
- {'Cleveland', 'Euclid', 'Bratenahl'}localities
- {'Cuyahoga'}counties
- TRUEintersect
- I-90TWAY_ID
- 10. Dwight D. Eisenhower Highway from Exit 105B to Exit 110BCities:Columbus
 Columbus
- 6Fatal Accidents
- 6fatalities
- 2Crashes Per Mile
- 4.1 milesdistance
- (39.93178889, -82.90837778)start
- (39.93263056, -82.83058056)end
- [ 1 17 20 31 32 37]points
- 9ordering
- {'Columbus'}localities
- {'Franklin'}counties
- TRUEintersect
- I-70TWAY_ID
Drunk Driving Involved in 32.3% of Fatal Accidents
Of the 3,189 fatal accidents that occurred in Ohio between 2018 and 2020, 32.3% were drunk driving-related. In most states, drunk driving contributes more to fatal car crashes than other factors like distracted driving, speeding and winter conditions. MoneyGeek’s study shows Ohio follows a similar pattern.
Blood alcohol concentration (BAC) measures the percentage of alcohol in a person’s bloodstream at a given time. In Ohio, a BAC of 0.08% makes you legally intoxicated, but consuming even a small amount of alcohol can impair your driving abilities.
Drunk driving also causes other repercussions outside of a fatality. The legal costs of drunk driving in Ohio are long-term and extensive, ranging from a license suspension to possible jail time.
If your license is suspended after a DUI conviction, you'll need to file an SR-22 certificate in Ohio to have it reinstated. An SR-22 tells car insurance providers you're a high-risk driver, which means higher rates. Some insurers do offer cheaper options after a DUI, but you'll still pay more than you did before the conviction.
Speeding Is a Factor in 27.4% of Fatal Crashes
Speeding was involved in 875 (27.4%) of all fatal crashes in Ohio from 2018 to 2020.
Speeding gives drivers less time to react, makes sudden stops harder and raises the risk of deadly crashes.
Distracted Driving Contributed to 5.1% of Fatal Accidents
From 2018 to 2020, 164 fatal accidents in Ohio involved distracted driving, making up 5.1% of all fatal crashes in the state. That's still a high count, but MoneyGeek's worst states for distracted driving study ranked Ohio 35th in the nation. Ohio had lower distracted driving accident rates than 69% of states.
August Had More Fatal Accidents Than Any Other Month
MoneyGeek found that August had the most fatal accidents from 2018 to 2020, with 345 crashes (10.8%). July had the second-highest fatal crash count at 338, or 10.6% of all deadly accidents. September came in third with 325 (10.2%) deadly crashes.
Driving Safely Protects You, Others and Your Wallet
You can help keep Ohio’s roads safe by being a responsible driver. Safe driving keeps your record clean and saves you hundreds of dollars a year on car insurance.
No matter how you drive, car insurance provides financial protection after an accident. If you cause a crash in Ohio, state law requires you to cover the other driver's bodily injury and property damage costs. Full coverage auto insurance also pays for damage to your own vehicle and covers medical expenses for you and your passengers.
The average auto insurance policy in Ohio costs $803 a year, but premiums vary by location. A car insurance policy in Toledo costs $837 annually. Auto coverage in Akron is $113 less than in Toledo. The average auto insurance plan in Columbus, Ohio’s most populated city, is $793 yearly.
Your premium will vary based on your age, driving experience and driving record. Comparing quotes from multiple insurers helps you find the most affordable car insurance rates.
Fatal Accidents and Most Dangerous Roads: County Breakdown
Fatal crashes from Ohio’s top five counties accounted for 30.3% of all fatal accidents, or 967 crashes. Franklin County had the most deadly crashes at 302, with most of these happening on I-270. MoneyGeek’s analysis found that most fatal crashes in the county involved drunk driving (92 accidents) and speeding (70 accidents).
Methodology
MoneyGeek analyzed fatality data from the National Highway Traffic Safety Administration Fatal Accident Reporting System’s (FARS) database for 2018, 2019 and 2020.
About Doug Milnes, CFA

Doug Milnes is a CFA charter holder with over 10 years of experience in corporate finance and the Head of Credit Cards at MoneyGeek. Formerly, he performed valuations for Duff and Phelps and financial planning and analysis for various companies. His analysis has been cited by U.S. News and World Report, The Hill, the Los Angeles Times, The New York Times and many other outlets.
Milnes holds a master’s degree in data science from Northwestern University. He geeks out on helping people feel on top of their credit card use, from managing debt to optimizing rewards.
Sources
- National Highway Safety Administration. "Fatal Accident and Reporting System (FARS)." Accessed June 24, 2026.
- Federal Highway Administration. "Highway Statistics Series." Accessed June 24, 2026.