
From 2017 to 2019, 1,060 fatal crashes occurred in New Mexico. MoneyGeek studied 459 roads out of the 150,216 miles of road in the state to determine which stretches were most dangerous. We also explored how some driver behaviors, like distracted driving, speeding and drunk driving, contributed to these crashes. Additionally, our analysis considered factors like weather and time of year. MoneyGeek provides a data summary for each county in New Mexico, including the deadliest road in each.
New Mexico Fatal Accident Study:
New Mexico’s Deadliest Roads and Fatal Accident Statistics
Updated: May 8, 2026
Advertising & Editorial Disclosure

Key Findings
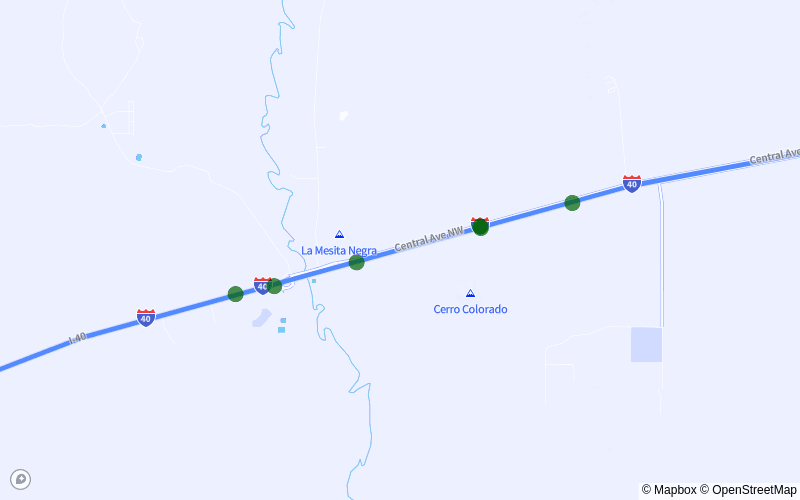
- Central Ave. from San Mateo Blvd. SE to Dorado PI. SE in Albuquerque is the deadliest stretch of road in New Mexico. From 2017 to 2019, 15 fatal crashes occurred there.
- Speeding contributed to 35% of accidents; drunk driving was involved in 28%.
- Distracted driving was involved in 36% of accidents. According to MoneyGeek’s distracted driving study, New Mexico is the worst state for distracted driving in the country.
- 10.6% of deadly accidents occurred in October, the most of any month. December (9.2%) and July (8.9%) had the following two highest numbers of crashes, respectively.
- Bernalillo had more fatal accidents than any other county. I-40 was the site of the highest number of crashes.
10 Deadliest Road Stretches in New Mexico
- 1. Central Ave. from San Mateo Blvd. SE to Dorado PI. SECities:Albuquerque
 Albuquerque
- 15Fatal Accidents
- 15fatalities
- 3Crashes Per Mile
- 4.7 milesdistance
- (35.07760556, -106.58608329999998)start
- (35.06871944, -106.50365559999999)end
- [ 0 1 2 4 5 7 9 11 12 14 15 16 17 18 21]points
- 48ordering
- {'Albuquerque'}localities
- {'Bernalillo'}counties
- TRUEintersect
- Central AveTWAY_ID
- 2. I-40 from Exit 154 to Exit 158Cities:Albuquerque
 Albuquerque
- 9Fatal Accidents
- 10fatalities
- 2Crashes Per Mile
- 4.1 milesdistance
- (35.09838611, -106.720925)start
- (35.10653611, -106.6486389)end
- [11 18 21 27 33 49 53 62 75]points
- 20ordering
- {'Albuquerque'}localities
- {'Bernalillo'}counties
- TRUEintersect
- I-40TWAY_ID
- 3. SR-45 Redlands Rd. NW to Central Ave. SWCities:Albuquerque
 Albuquerque
- 9Fatal Accidents
- 9fatalities
- 3Crashes Per Mile
- 2.7 milesdistance
- (35.11924722, -106.70173059999999)start
- (35.08075833, -106.7106)end
- [ 0 2 4 5 9 12 14 15 16]points
- 30ordering
- {'Albuquerque'}localities
- {'Bernalillo'}counties
- TRUEintersect
- SR-45TWAY_ID
- 4. SR-118 from Navajo Blvd. to Rehoboth Dr.Cities:Gallup | Church Rock
 Gallup | Church Rock
- 7Fatal Accidents
- 8fatalities
- 2Crashes Per Mile
- 4.0 milesdistance
- (35.52555556, -108.58565279999999)start
- (35.53248889, -108.65675559999998)end
- [0 1 2 3 4 5 7]points
- 12ordering
- {'Gallup', 'Church Rock', 'Not Applicable'}localities
- {'Mckinley'}counties
- TRUEintersect
- SR-118TWAY_ID
- 5. I-40 from Exit 140 to Lost Horizon Dr. NWCities:Albuquerque | Other
 Albuquerque | Other
- 6Fatal Accidents
- 7fatalities
- 1Crashes Per Mile
- 4.8 milesdistance
- (35.02935278, -106.95905)start
- (35.04745556, -106.87729170000001)end
- [25 26 39 51 64 82]points
- 7ordering
- {'Albuquerque', 'Other'}localities
- {'Bernalillo'}counties
- TRUEintersect
- I-40TWAY_ID
- 6. I-25 from Exit 232 to Exit 226ACities:Albuquerque
 Albuquerque
- 6Fatal Accidents
- 6fatalities
- 1Crashes Per Mile
- 4.8 milesdistance
- (35.16898333, -106.58513329999998)start
- (35.10934444, -106.62753329999998)end
- [ 0 8 22 33 35 46]points
- 8ordering
- {'Albuquerque'}localities
- {'Bernalillo'}counties
- TRUEintersect
- I-25TWAY_ID
- 7. Gibson Blvd. SE from Valencia Dr. SE to Broadstone WayCities:Albuquerque
 Albuquerque
- 6Fatal Accidents
- 6fatalities
- 2Crashes Per Mile
- 2.6 milesdistance
- (35.05822222, -106.5808278)start
- (35.05851667, -106.62720279999999)end
- [0 1 2 3 4 5]points
- 14ordering
- {'Albuquerque'}localities
- {'Bernalillo'}counties
- TRUEintersect
- Gibson Blvd SeTWAY_ID
- 8. US-62 from Red Cloud Rd. to E-38Cities:Lea County
 Lea County
- 5Fatal Accidents
- 6fatalities
- 1Crashes Per Mile
- 4.5 milesdistance
- (32.52988333, -103.7967222)start
- (32.55464722, -103.7259722)end
- [ 0 2 5 8 13]points
- 6ordering
- {'Not Applicable'}localities
- {'Lea'}counties
- TRUEintersect
- US-62TWAY_ID
- 9. Central Ave from 1st St. SW to Volcano Rd. NWCities:Albuquerque
 Albuquerque
- 5Fatal Accidents
- 5fatalities
- 1Crashes Per Mile
- 4.5 milesdistance
- (35.08415278, -106.64810559999998)start
- (35.07608889, -106.72775559999998)end
- [ 3 6 8 10 19]points
- 5ordering
- {'Albuquerque'}localities
- {'Bernalillo'}counties
- TRUEintersect
- Central AveTWAY_ID
- 10. SR-45 from Kirsten Rd SW to Huseman PI. SWCities:Albuquerque
 Albuquerque
- 5Fatal Accidents
- 5fatalities
- 2Crashes Per Mile
- 2.9 milesdistance
- (35.00401667, -106.7172111)start
- (35.04514722, -106.7097139)end
- [ 1 3 7 11 13]points
- 9ordering
- {'Albuquerque'}localities
- {'Bernalillo'}counties
- TRUEintersect
- SR-45TWAY_ID
Drunk Driving Involved in 28% of Fatal Accidents
Out of the 1,060 recorded fatal crashes in New Mexico between 2017 and 2019, 296 were associated with drunk driving.
State law considers drivers with a blood alcohol concentration (BAC) of 0.8% legally drunk. However, alcohol begins impairing your ability to operate a car at a lower BAC. A BAC of 0.2% is enough to cause slow reaction time, lack of coordination and reduced concentration.
The cost of drunk driving is high, even if it doesn’t result in fatalities. At the very least, your license might be suspended and your driving privileges restricted. Worst case scenario, you could face possible jail time. Another guaranteed outcome is less affordable auto insurance in New Mexico.
Speeding Is a Factor in 35% of Fatal Crashes
From 2017 to 2019, speeding contributed to 370 fatal crashes in New Mexico. That’s 35% of the total number of accidents resulting in deaths recorded in the state.
Driving your car above the legal speed limit has several consequences, such as a higher likelihood of losing control and increased stopping distance. It also increases the probability of a severe injury since speeding minimizes the effectiveness of protective equipment inside and outside your car.
Distracted Driving Contributed to 36% of Fatal Accidents
Distracted driving was involved in 382 deadly crashes in the state, or 36% of all accidents that resulted in death. MoneyGeek’s distracted driving study found that New Mexico is the worst state in the U.S. for distracted driving and has the highest distracted driving fatality rate in the country.
October Had More Fatal Accidents Than Any Other Month
MoneyGeek also looked at when most fatal accidents occurred during the year. October had the highest number of crashes of any month, with 112 resulting in death; that translates to 10.6% of all fatal accidents in New Mexico between 2017 and 2019. After October, the two months with the next-highest incidents of deadly crashes are December (98) and July (94).
Driving Safely Protects You, Others and Your Wallet
Being a safe driver doesn’t just help save lives — it also allows you to manage your finances better. Sometimes, accidents happen no matter how hard we try to drive carefully, pointing to the necessity of car insurance. Having coverage is one way to ensure you and your loved ones have protection.
The average cost of full coverage insurance in New Mexico is $1,133 per year on average. The average cost of auto insurance in Albuquerque, the state's most populous city, is the same. Drivers in other cities may have different rates, though.
The premiums mentioned above only reflect average rates. Remember that you may receive a different quote based on your age, driving history and other individualized factors. Costs also vary between insurers, so comparing quotes from multiple providers can help you find the cheapest car insurance company for your needs.
Fatal Accidents and Most Dangerous Roads: County Breakdown
The five counties in New Mexico with the most occurrences of fatal accidents accounted for nearly 60% of all crashes resulting in deaths. That translates to 634 incidents in three years.
Bernalillo had 287 fatal crashes, the most of any county. Most of these happened along I-4 and involved distracted driving and speeding.
Methodology
Using the National Highway Traffic Safety Administration Fatal Accident Reporting System (FARS) database, MoneyGeek analyzed fatality data from 2017, 2018 and 2019. Currently, 2019 is the latest data available in the system.
About Doug Milnes, CFA

Doug Milnes is a CFA charter holder with over 10 years of experience in corporate finance and the Head of Credit Cards at MoneyGeek. Formerly, he performed valuations for Duff and Phelps and financial planning and analysis for various companies. His analysis has been cited by U.S. News and World Report, The Hill, the Los Angeles Times, The New York Times and many other outlets.
Milnes holds a master’s degree in data science from Northwestern University. He geeks out on helping people feel on top of their credit card use, from managing debt to optimizing rewards.
Sources
- Federal Highway Administration. "Highway Statistics Series." Accessed February 3, 2022.
- National Highway and Traffic Safety Administration. "Speeding." Accessed February 16, 2022.
- National Highway Safety Administration. "Fatal Accident and Reporting System (FARS)." Accessed February 3, 2022.